In the crypto market, every investor eventually chooses their own preferred style — whether that’s deep fundamental research (tokenomics, narratives, capital flow) or short-term trading. But regardless of how strong your fundamentals are, without a basic grasp of technical analysis, it’s easy to get lost when the market reverses. True success in crypto requires mastering all layers — fundamental, technical, and on-chain analysis — to read the market, adapt, and survive volatility.
This guide covers the most essential yet practical crypto indicators every serious market participant must understand — not just for trading, but to track capital flows, identify trends, and manage risk in crypto’s unpredictable environment.
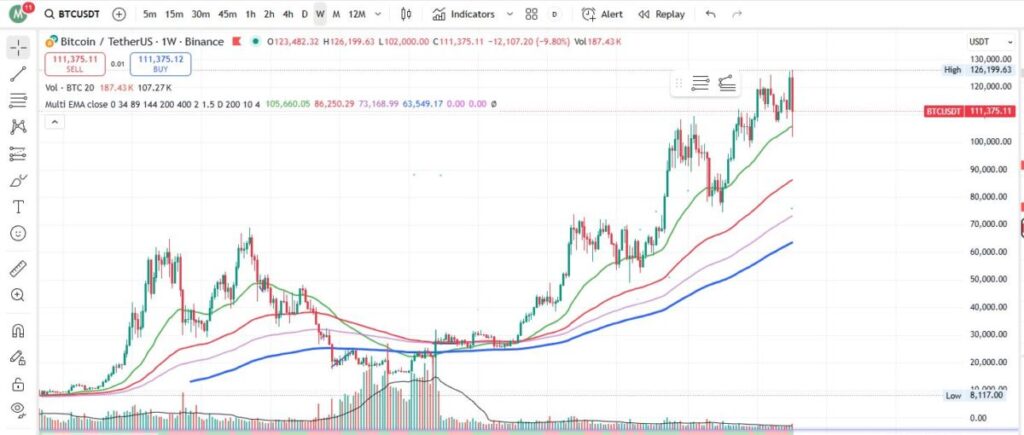
1.Bitcoin Analysis (BTC)
a. Bitcoin Chart
Bitcoin is not just the leading asset — it’s the heartbeat of the entire crypto ecosystem.
Every BTC move — whether a short pump or a correction — triggers ripple effects across altcoins, stablecoin yields, and DeFi liquidity.
That’s why even fundamental researchers and long-term investors must grasp Bitcoin’s technical structure to spot opportunities, risks, and trend shifts early.
b. Bitcoin Dominance (BTC.D)
BTC Dominance measures Bitcoin’s market cap as a percentage of total crypto market cap.
It’s a classic indicator showing capital rotation between BTC and altcoins.
Interpretation:
- BTC.D rising → Bitcoin is outperforming; altcoins may consolidate or correct.
- BTC.D falling → Funds are rotating into altcoins; an altseason could be starting.
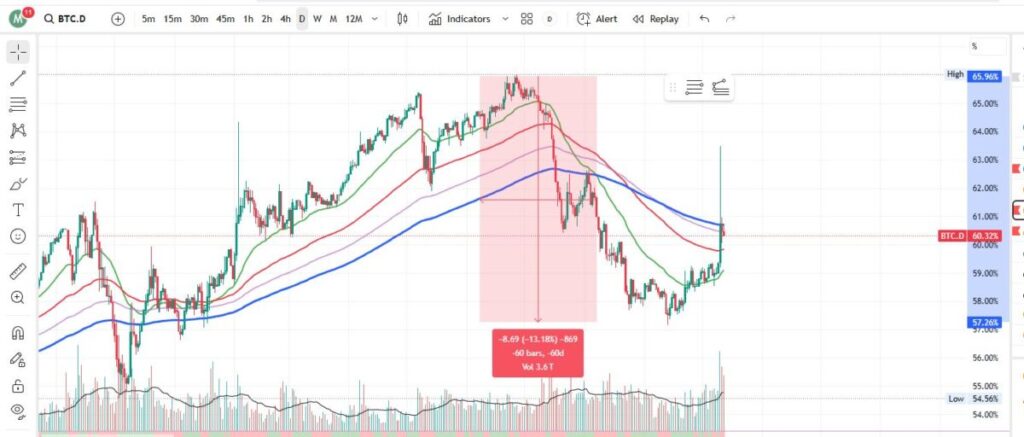
Example: In January 2025, BTC.D dropped from 48% → 43%, coinciding with the explosive rally in SOL, ETH, and AI-agent narratives.
Use case: BTC.D helps traders gauge overall market sentiment, spot rotations into altcoins, and determine when to shift exposure between BTC and alts.
c. BTC CME Gap
The CME Gap represents the price difference between Friday’s close and Monday’s open on the CME Futures exchange. Since CME pauses on weekends but crypto trades 24/7, these gaps naturally appear.
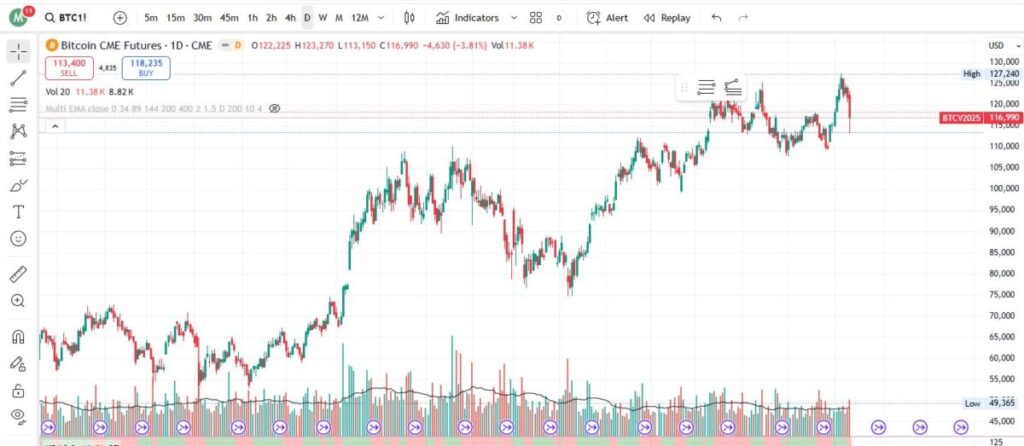
Key insights:
- Prices often “fill the gap,” reverting to CME open levels.
- Reflects institutional traders’ positioning and potential manipulations.
- Post-ETF era may reduce CME impact, but the gaps remain a useful technical reference.
2.Stablecoin Dominance & Flow Tracking
Stablecoin Dominance measures the share of stablecoin market cap within total crypto capitalization — essentially the market’s cash reserves waiting to re-enter BTC or altcoins.
2.1. Meaning of Stablecoin Dominance Movements
- Rising Dominance → Investors shifting from crypto to stables for safety. Typically happens during BTC dumps or when market fear increases.
- Falling Dominance → Funds rotating back into risk assets, signaling early uptrend phases or altseason.
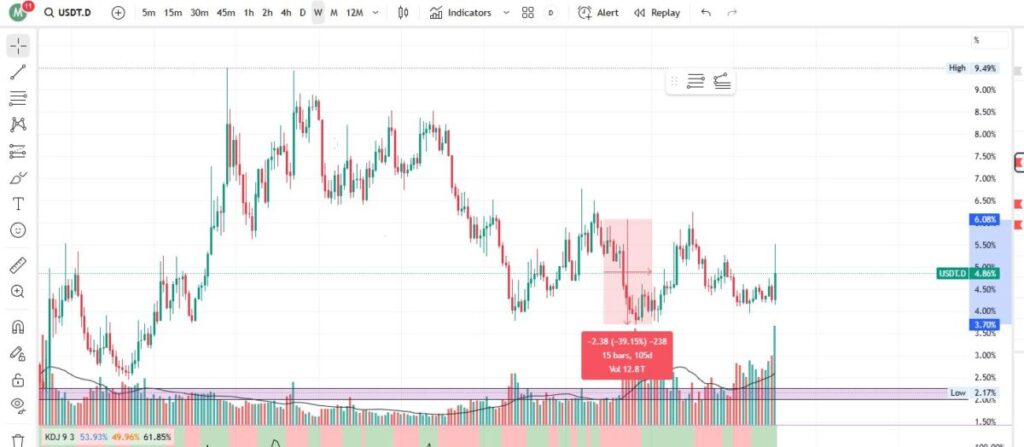
Example:
Between Dec 2024 – Jan 2025, USDT.D dropped from 6% → 3%, coinciding with the explosive AI-Agent trend rally.
2.2. Key Stablecoin Behaviors
USDT
- Represents CEX liquidity and retail flow.
- A strong increase in USDT supply often precedes market FOMO.
- Track via USDT Supply Growth or USDT Netflow.
USDC:
- Reflects institutional and DeFi liquidity.
- USDC supply rises during risk-off phases as funds sit idle.
- Negative Netflow (withdrawals) often signals institutions re-entering the market.
3.“Total” Charts – Reading Market Capital Flows
The Total charts (Total, Total2, Total3) visualize macro liquidity across the crypto market, helping traders understand where the capital is flowing.
3.1. Total (Entire Crypto Market Cap)
Represents total crypto capitalization, including BTC, ETH, and all alts.
Purpose:
- Measures overall market expansion or contraction.
- When Total breaks resistance with consistent growth, it confirms a macro uptrend.
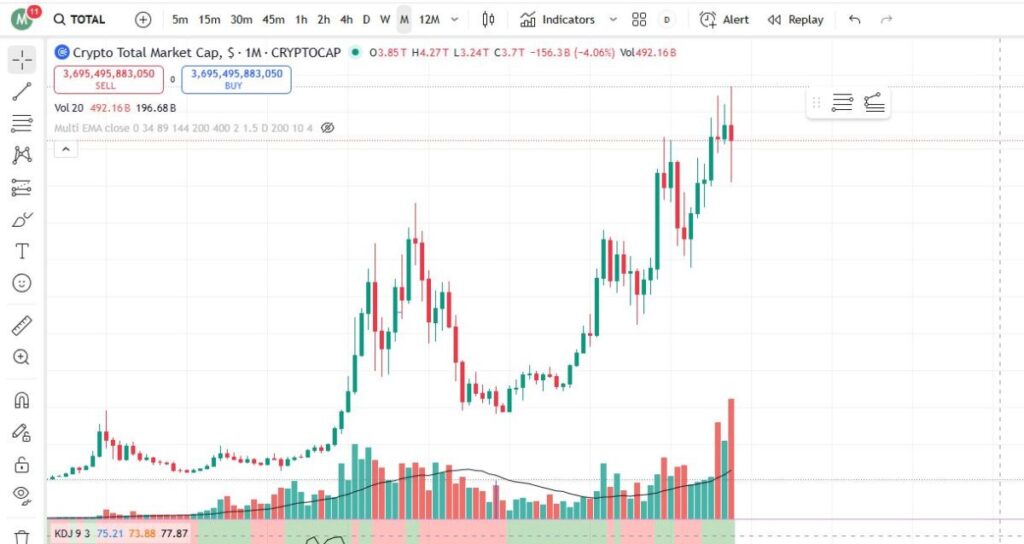
Example: From Sept 2024 → early 2025, Total rose from $2T → $4T, marking a strong recovery post-crypto winter, led by BTC and ETH.
Application:Combine with EMA 34/89 for long-term trend validation. If Total makes new highs while BTC.D stays flat or falls, it signals altcoin inflows.
3.2. Total2 (Excluding Bitcoin)
Total2 measures crypto’s market cap without BTC, isolating altcoin strength.
Interpretation:
- When Total2 rises faster than Total, capital is rotating into alts.
- When Total2 falls while BTC holds, investors are hiding in BTC (risk-off).
Example: In March 2025, BTC stayed around $65K, but Total2 surged from $820B → $1.05T, driven by ETH, SOL, BNB, SEI, and SUI.
Use case: Combine Total2 + BTC.D:
- Total2 ↑ + BTC.D ↓ → Altseason confirmed.
- Track RSI (>60) to confirm sustained altcoin strength.
3.3. Total3 (Excluding BTC & ETH)
Reflects the market cap of mid and small-cap altcoins — the purest metric of speculation.
Interpretation:
- Total3 rising = speculative altseason.
- Total3 dropping = capital retreating to BTC/stables (risk-off).
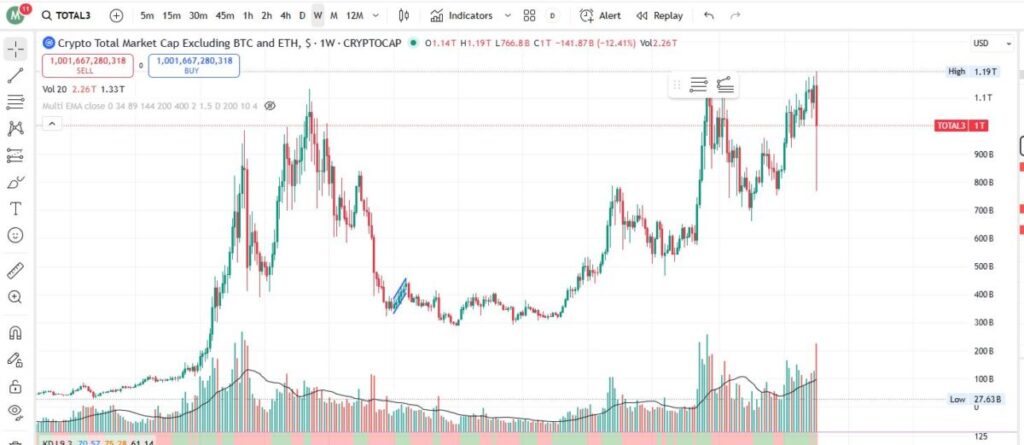
Example: From Sept 2024 → early 2025, Total3 jumped from $500B → $1T during the Solana meme season (BONK, WIF) and hot trends like AI, RWA, DeFi 2.0. By July 2025, as BTC.D reversed upward, Total3 fell to $520B, signaling capital exit from risk assets.
Use case: Combine Total3 + USDT.D:
- Total3 ↑ + USDT.D ↓ → money flowing into alts.
- Total3 ↓ + USDT.D ↑ → defensive phase, alts being sold off. Use EMA100 + RSI50 for mid-term reversal timing.
4.Top Coins & Alt/BTC Pairs
4.1. Top Coins (BTC, ETH, SOL, BNB)
These leaders dictate the market’s overall direction. When they move in sync, the entire market follows.
Application:
- Volume: confirms trend strength.
- Rising price + rising volume = strong move.
- MACD: Bullish crossover = sustainable uptrend.
- EMA 34–89–200: defines dynamic support/resistance.
- Price above EMA 34/89 = short/mid-term bullish.
Example: BTC +5%, ETH +8%, SOL +7% with volume surging = early signs of altseason formation.
4.2. Altcoin/BTC Pairs
These pairs measure relative strength of altcoins vs. Bitcoin, key to spotting capital rotations.
Interpretation:
- Alt/BTC rising → Alts outperforming → funds flowing out of BTC.
- Alt/BTC falling → Alts lagging → capital retreating to BTC.
Application:
- RSI:
- 70 = overbought; correction likely.
- <30 = oversold; potential rebound.
- EMA + MACD:
- EMA34 crosses above EMA89 + MACD bullish crossover = altcoin inflow signal.
Example: ETH/BTC rising 0.070 → 0.080 while BTC moves sideways → ETH outperforming → potential early altseason.
5.Key Technical Indicators in Crypto Analysis
5.1. RSI (Relative Strength Index)
Measures price momentum (0–100), showing overbought/oversold conditions.
Reading:
- RSI > 70 → overbought, possible correction.
- RSI < 30 → oversold, potential rebound.
- RSI ≈ 50 → sideways market.
Application:
- BTC or Total3 holding RSI 55–65 → healthy sustainable uptrend (not FOMO).
- Altcoins with RSI >70 and holding >60 → strong trend confirmation.
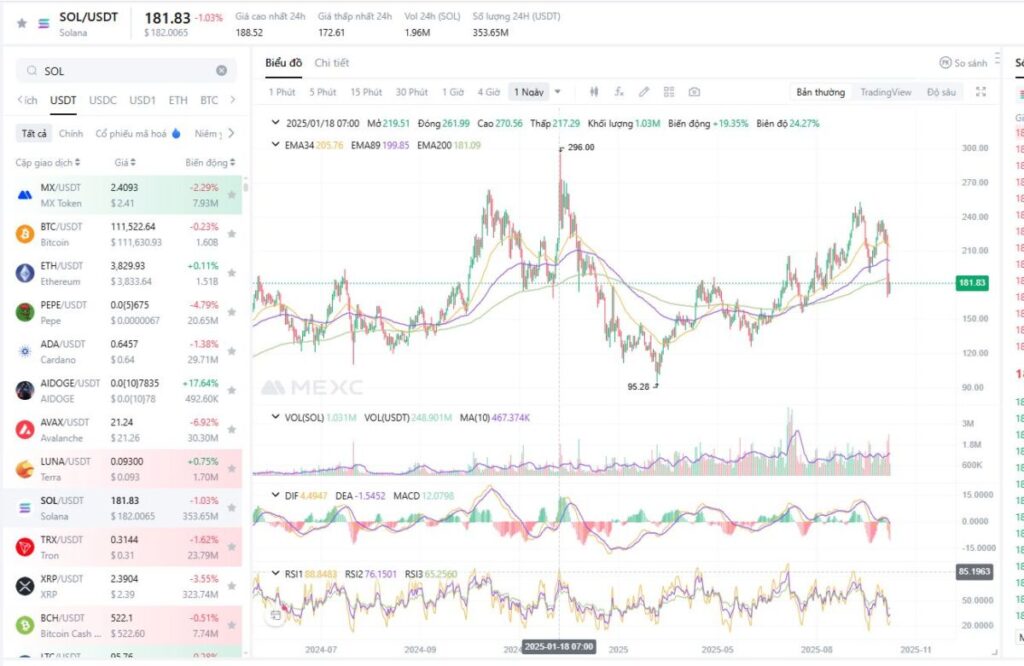
Example: In Feb 2025, SOL’s RSI shot above 80 — marking an exhaustion top before reversal.
5.2. Volume
Represents the total traded amount over a given period — showing liquidity and conviction.
Interpretation:
- Price ↑ but volume ↓ → weak move, likely fakeout.
- Price ↑ + volume ↑ → strong, real inflow.
- High volume in sideways range → imminent breakout.
Application:
- High volume at bottom = accumulation.
- High volume at top = distribution.
- Combine with EMA for trend confirmation.
5.3. MACD (Moving Average Convergence Divergence)
Shows momentum via the relationship between EMA12 & EMA26.
Reading:
- MACD crosses above Signal → bullish.
- MACD crosses below Signal → bearish.
- Wider gap = stronger trend.
Application: Best used on 1D or 1W timeframes for trend reversals. When MACD crosses up + RSI >55 + volume rising → strong confirmation of trend continuation.
5.4. EMA (Exponential Moving Average)
Weighted moving average giving more importance to recent prices.
In crypto, due to high volatility, EMA34, EMA89, and EMA200 are widely used.
Meaning:
- EMA34: short-term momentum → entry/exit timing.
- EMA89: mid-term trend stability → healthy trend if price holds above.
- EMA200: long-term sentiment barrier.
- Price above EMA200 = bull phase.
- Price below EMA200 = bear or accumulation zone.
6.Conclusion
Understanding these indicators doesn’t make you a prophet — but it gives you clarity in chaos. In crypto, the goal isn’t to predict every move — it’s to read capital flow, manage risk, and survive long enough to catch the next big cycle.
Disclaimer: This content does not constitute investment, tax, legal, financial, or accounting advice. MEXC provides this information for educational purposes only. Always DYOR, understand the risks, and invest responsibly
Enjoy Most Trending Tokens, Everyday Airdrops, Xtremely Low Fees and Comprehensive Liquidity!
Sign Up App Store
 Android APK