
In crypto trading, traders and investors must employ reliable tools to accurately predict price movements. One of the most common methods is by using Fibonacci retracement.
A retracement is a favored indicator as it significantly aids in the analytical process, enabling precise buying or selling decisions in crypto assets.
Now, in this article, I will provide a brief overview of how to read and utilize Fibonacci Retracement in crypto trading.
What Is Fibonacci Retracement?
Fibonacci retracement is a tool used as an indicator to identify potential levels of support and resistance in crypto trading or other commodities.
This tool is based on the Fibonacci sequence, connecting the lowest and highest price points and dividing the vertical distance with key ratios such as 0.236 (23.6%), 0.382 (38.2%), 0.5 (50%), 0.618 (61.8%), and 0.786 (78.6%).
Retracement levels are typically used to anticipate potential reversal or continuation areas in price. Logically, these retracement levels align with support or resistance zones, reflecting the current market behavior.
For example, in an uptrend with a significant rise in prices followed by a retracement, traders may look for potential support levels at Fibonacci levels like 38.2% or 50%. Conversely, in a downtrend, these levels may indicate resistance areas where prices are likely to bounce lower.
Fibonacci retracement is often used in conjunction with other technical analysis tools to confirm signals and strengthen overall market analysis.
Traders or investors may combine it with various technical indicators such as Moving Averages, Oscillators, and Trendlines.
How to Read Fibonacci Retracement?
Reading Fibonacci retracement is not complicated. The pattern is drawn between the highest and lowest points, helping identify where support and resistance points lie within that range.
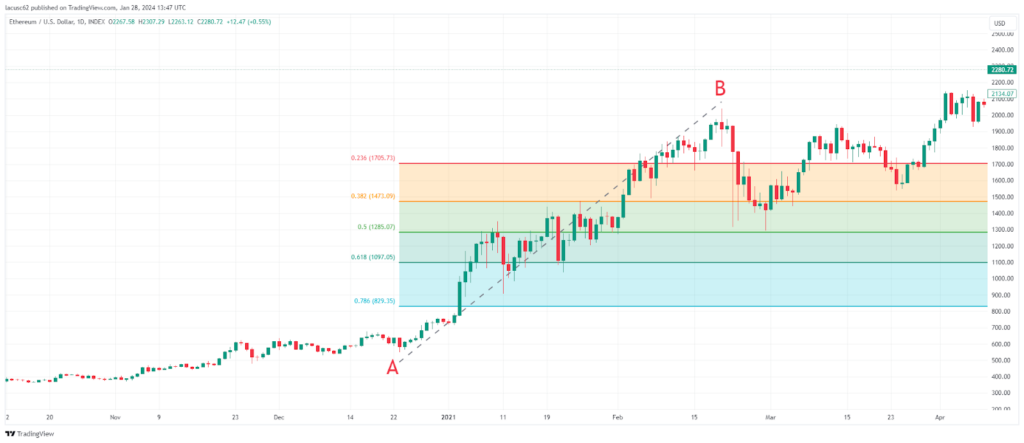
Let’s illustrate this on the ETH/USD chart above to better understand how to read Fibonacci retracement.
A retracement is drawn from level A (lowest) to level B (highest), with Fibonacci numbers placed in the middle, ranging from 0.236 (23.6%) at the top to 0.786 (78.6%) at the bottom.
In the chart, we can see ETH prices rising from point A to B and then returning to the 0.5 (50%) level. When a rebound occurs at that level, it indicates a strong bullish trend.
Ideally, rebounds occur precisely at Fibonacci numbers, such as 0.618 (61.8%). This level serves as a stop-loss point, suggesting that the likelihood of a continuation of the uptrend is lower below this point.
Profit targets can be set by placing profit orders at higher levels, aligned with other Fibonacci numbers, such as 0.236 (23.6%).
How to Use Fibonacci Retracement
After understanding some basic information and how to read Fibonacci Retracement above, it’s time to apply it to trading.
1. Identify Market Trends
Determine the direction of the market trend and ensure whether price movements are upward or downward. Fibonacci retracement is essentially used to support the existing trend.
After understanding the trend, choose two points on the chart: the swing low and swing high levels. This forms the range that defines the retracement.
2. Draw Retracement Lines
Next, draw retracement lines from the lowest point to the highest point (if it’s an uptrend) or vice versa (if it’s a downtrend).
These lines will intersect the price range with Fibonacci levels such as 0.236 (23.6%), 0.382 (38.2%), 0.5 (50%), 0.618 (61.8%), and 0.786 (78.6%).
3. Identify Key Levels
Also, pay attention to where prices approach or reach Fibonacci levels. These levels essentially act as areas indicating potential price reversals or continuations.
4. Combine with Other Indicators
Ensure to combine Retracement with other indicators to confirm signals. The combination of these analytical tools can provide a stronger understanding of price movements.
Fibonacci Retracement Pros and Cons
Fibonacci Retracement also comes with its own set of advantages and disadvantages:
Pros
- Effectiveness: It is effective in supporting trend analysis, and helping traders identify potential levels for reversal or continuation.
- Flexibility: Fibonacci retracement can be used in conjunction with other technical indicators and analysis tools, making it more flexible in decision-making.
- Ease of Use: This tool is relatively easy to apply, especially for beginner traders. Its implementation is straightforward, and many trading platforms now provide tools for automatically drawing retracements.
Cons
- Subjective: The process of selecting swing lows and swing highs involves subjectivity and can result in different interpretations among traders.
- Not Completely Accurate: Fibonacci retracement does not always provide accurate predictions as market movements are influenced by various factors.
- Limited Use: There are situations where retracement is not as effective, especially in highly volatile markets or those experiencing sudden trend changes.
Conclusion
Fibonacci Retracement is a valuable technical analysis tool that traders use to identify potential levels of support and resistance. Its reputation for accuracy in interpreting market movements makes it a fitting choice for application in crypto trading.
However, it’s crucial to recognize that Fibonacci analysis is subjective, and its results can differ among traders. Therefore, it’s advisable to complement it with other technical patterns for a more comprehensive and robust analysis.
Personal Note From MEXC Team
Check out our MEXC trading page and find out what we have to offer! There are also a ton of interesting articles to get you up to speed with the crypto world. Lastly, join our MEXC Creators project and share your opinion about everything crypto! Happy trading! Learn about interoperability now!
Join MEXC and Start Trading Today!
 – Session with AJ Crypto")

