Meta Description: Bitcoin confirms 4th death cross since 2023, trading at $90K with $870M ETF outflows. Historical data shows pattern marks local bottoms—but this time different?

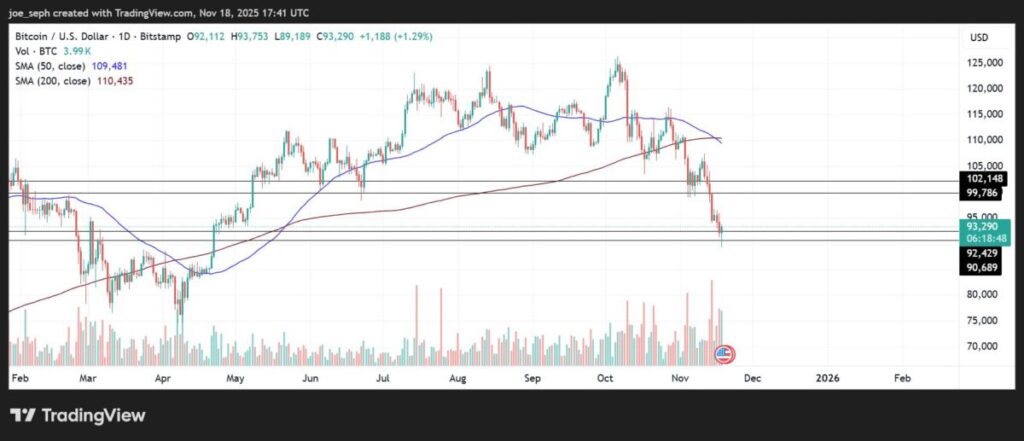
Bitcoin has confirmed a “death cross” pattern as its 50-day moving average ($110,669) crossed below the 200-day moving average ($110,459), a technical formation traditionally viewed as a bearish signal in market analysis. Trading around $93,000 as of November 17, Bitcoin is down approximately 27% from its October all-time high of $126,000, erasing months of gains and testing investor conviction at critical support levels.
However, this death cross carries a unique historical context. This marks the fourth occurrence of the death cross since the cycle started in 2023, and each previous instance has aligned with major local bottoms. With the Fear & Greed Index plunging to 10, indicating extreme fear, and record ETF outflows challenging market structure, the question facing traders is whether history will repeat—or if Bitcoin’s fourth death cross signals something more severe.
This article examines the technical setup, institutional flow dynamics, and key price levels that will determine whether Bitcoin has found a bottom or faces further downside in the weeks ahead.
Death Cross Pattern: Historical Context Suggests Caution—and Opportunity
In September 2023, Bitcoin bottomed near $25,000; in August 2024 during the yen carry trade unwind it found support around $49,000; and in April 2025, during uncertainty around President Trump’s tariff policy, BTC bottomed below $75,000. In each case, the death cross marked the low point before significant rallies followed.
Crypto analyst Benjamin Cowen noted that while past death crosses have frequently marked local bottoms, this pattern breaks down once the macro cycle ends. His analysis suggests that if Bitcoin’s current cycle remains intact, a bounce should materialize within the next week. However, if no recovery emerges, another leg lower becomes likely before a larger relief rally toward the 200-day simple moving average.
Market data from 2014 to 2025 shows mixed short-term outcomes following death crosses but strong medium- to long-term rebounds in many cycles. One to three weeks post-cross, returns have been nearly 50/50 between gains and losses, with median returns slightly positive (approximately 0.25–2.35%). However, 2-3 month returns have historically shown significant upside, with many instances delivering 15-27% gains.
This statistical backdrop provides context but offers no guarantees. Each market cycle operates within unique conditions, and Bitcoin’s November 2025 environment includes factors previous death crosses did not face.
ETF Outflows Hit Record Levels: Institutional Confidence Wavers
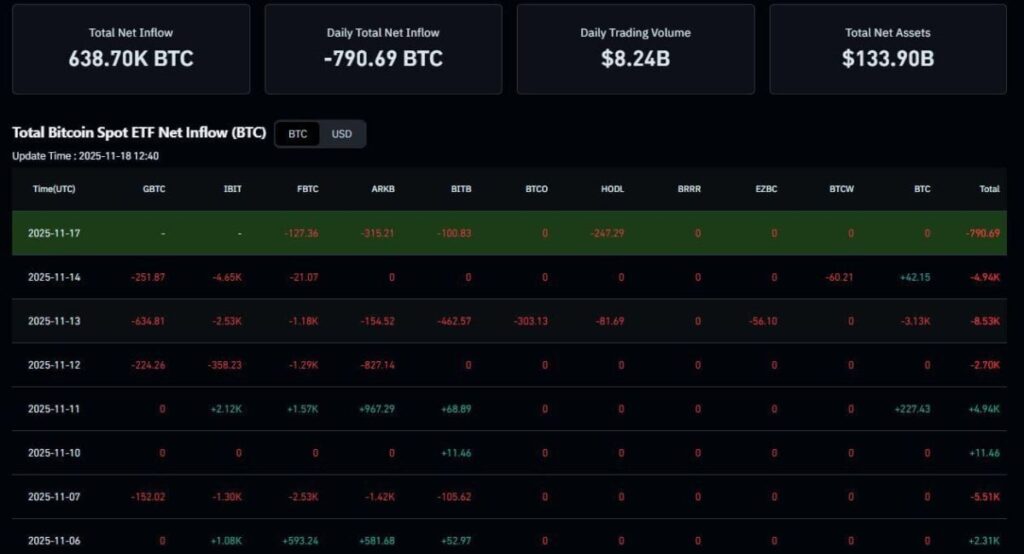
The institutional narrative surrounding Bitcoin has shifted dramatically in November. The 11 U.S.-listed spot Bitcoin exchange-traded funds collectively bled $869.86 million on Thursday, November 14, registering their second-highest outflow on record. Investors have pulled out $2.64 billion over three weeks, signaling growing caution and shifting sentiment in the market.
Grayscale Bitcoin Mini Trust recorded the largest outflow of $318.2 million, followed by BlackRock’s IBIT, which saw $256.6 million bleed, while Fidelity’s FBTC and Bitwise’s BITB had $119.93 million and $47.03 million in net outflows, respectively. These figures represent a dramatic reversal from October, when ETFs experienced strong inflows during Bitcoin’s rally to $126,000.
The timing of these outflows coincides with Bitcoin breaking below the psychologically critical $100,000 level for the first time in 188 days. On-chain data from CryptoQuant shows a growing disconnect between short-term and long-term Bitcoin holders, with short-term selling pressure surging sharply. Short-term holders, those who acquired BTC within the past 155 days—are capitulating at a rate of 49,120 BTC, one of the highest readings in months, while long-term holders remain largely inactive with minimal selling.
This dynamic suggests that recent buyers who entered near the October peak are exiting positions at losses, creating downward pressure that may need to be fully absorbed before a sustainable recovery can begin.
Critical Support and Resistance Levels: The Road Ahead
Bitcoin’s price action over the next 1-2 weeks will likely determine whether the death cross marks a capitulation bottom or the midpoint of a deeper correction. Key technical levels include:
Immediate Support: $92,000–$94,000 This zone represents the 6-12 month holder cost basis, a level where investors who accumulated during Bitcoin’s consolidation phase hold positions. Bitcoin fell to a fresh six-month low below $93,000, briefly testing this support before stabilizing. A decisive break below $92,000 would likely trigger additional stop-losses and accelerate downside momentum.
Major Support: $74,000–$82,000 Technical analysis reveals a potential 30% downside to $74,000 if support breaks, matching April 2025 lows. This level aligns with the 50% Fibonacci retracement from Bitcoin’s cycle low to its October peak and represents the next major demand zone. While a move to this range would be psychologically painful for recent buyers, it would bring Bitcoin back to levels that historically marked strong accumulation zones.
Resistance: $100,000 (Psychological) Reclaiming the six-figure milestone is the first requirement for shifting market sentiment back toward bullishness. Bitcoin must hold above $100,000 on weekly closes to invalidate the bearish case and signal that the correction has run its course.
Resistance: $107,000–$110,000 The death cross zone itself, where the 50-day and 200-day moving averages converged, represents formidable overhead resistance. Bitcoin would need to reclaim these levels decisively, ideally accompanied by strong volume, to confirm that the downtrend has ended and a new uptrend is beginning.
Macro Headwinds: Fed Uncertainty and Government Shutdown Impact
Beyond technical factors, macroeconomic conditions are contributing to Bitcoin’s weakness. The ongoing U.S. government shutdown, which began October 1, has complicated data visibility and contributed to risk-off sentiment across markets. Since the shutdown began, ETF flows have mostly been negative, apart from the first week of October when Bitcoin briefly rallied from $114,000 to $126,000.
Federal Reserve policy uncertainty adds another layer of complexity. With the December 9-10 FOMC meeting approaching, market expectations for a rate cut have collapsed from 95% to approximately 50%, creating uncertainty around liquidity conditions in early 2026. Fed Chair Jerome Powell’s recent comments describing “strongly differing views” among officials have reinforced the perception that monetary policy could remain restrictive for longer than previously anticipated.
The 2018-2019 government shutdown coincided with a market bottom for Bitcoin in that cycle, offering a potential historical parallel. If the current shutdown extends beyond November 16—an outcome that prediction markets currently assign a 50% probability—Bitcoin could face continued pressure until resolution provides clarity.
Trading Strategies for the Death Cross Environment
Given the elevated uncertainty and mixed historical signals, traders should employ disciplined risk management rather than making directional bets:
For Short-Term Traders:
- Wait for confirmation: A weekly close above $98,000 with strong volume would signal the low is likely in. Conversely, a weekly close below the 50-week exponential moving average suggests more downside ahead.
- Use tight stops: Given 7-10% daily volatility, position sizes should be reduced and stop-losses placed 3-5% below entry to limit damage from false breakouts.
- Monitor whale activity: On-chain metrics showing reduced exchange inflows and stabilizing long-term holder distribution would indicate capitulation is complete.
For Accumulation-Focused Investors:
- Dollar-cost average: Rather than attempting to time the exact bottom, scale into positions across the $90,000–$100,000 range over 2-4 weeks.
- Set alerts for key levels: $92,000 (breakdown confirmation) and $100,000 (recovery confirmation) represent critical decision points.
- Prepare dry powder: If Bitcoin reaches the $74,000–$82,000 zone, historical patterns suggest this could represent an exceptional long-term entry point.
Risk Management Tools on MEXC:
- Set take-profit orders at resistance levels ($100K, $107K) to lock in gains during relief rallies
- Use stop-loss orders 5-8% below entry to cap maximum loss
- Consider grid trading strategies to capitalize on range-bound volatility
- Monitor MEXC’s real-time funding rates to gauge sentiment shifts in perpetual futures markets
Conclusion: A Pivotal Moment, Not a Verdict
Bitcoin’s fourth death cross since 2023 presents a textbook example of technical analysis meeting market psychology. History suggests this pattern has reliably marked local bottoms, yet the magnitude of institutional outflows, the severity of the price decline, and the uncertain macro backdrop create legitimate reasons for caution.
Benjamin Cowen’s framework offers a useful guide: if Bitcoin stages a bounce within the next 7 days, the cycle likely remains intact; if no bounce materializes, expect another leg lower before a larger recovery. Traders should remain alert, watch key support levels, and be prepared for continued volatility even as potential medium- and long-term gains remain within reach.
What distinguishes this moment from pure capitulation is the absence of systemic failure or existential threats to Bitcoin’s network or value proposition. Unlike the FTX collapse in late 2022 or the Terra/Luna implosion, Bitcoin’s current weakness stems primarily from profit-taking, leverage washouts, and temporary institutional hesitation—not fundamental breakdowns.
For those with patience and proper risk management, historical patterns suggest that Bitcoin’s death crosses have consistently presented accumulation opportunities rather than signals to exit entirely. Whether this fourth instance follows the same script remains to be seen, but the coming days will provide critical clues.
Trade Bitcoin on MEXC: Navigate Bitcoin’s volatility with MEXC’s comprehensive trading tools, including spot and perpetual futures with up to 125x leverage, advanced order types (TP/SL, trailing stops), and real-time market data. Currently participating in MEXC’s 0-Fee Fest, users can trade BTC/USDT pairs with zero maker fees, significantly reducing costs during periods of high market activity.
Disclaimer:This content is for educational and reference purposes only and does not constitute any investment advice. Digital asset investments carry high risk. Please evaluate carefully and assume full responsibility for your own decisions.
Enjoy Most Trending Tokens, Everyday Airdrops, Xtremely Low Fees and Comprehensive Liquidity!
Sign Up App Store
 Android APK