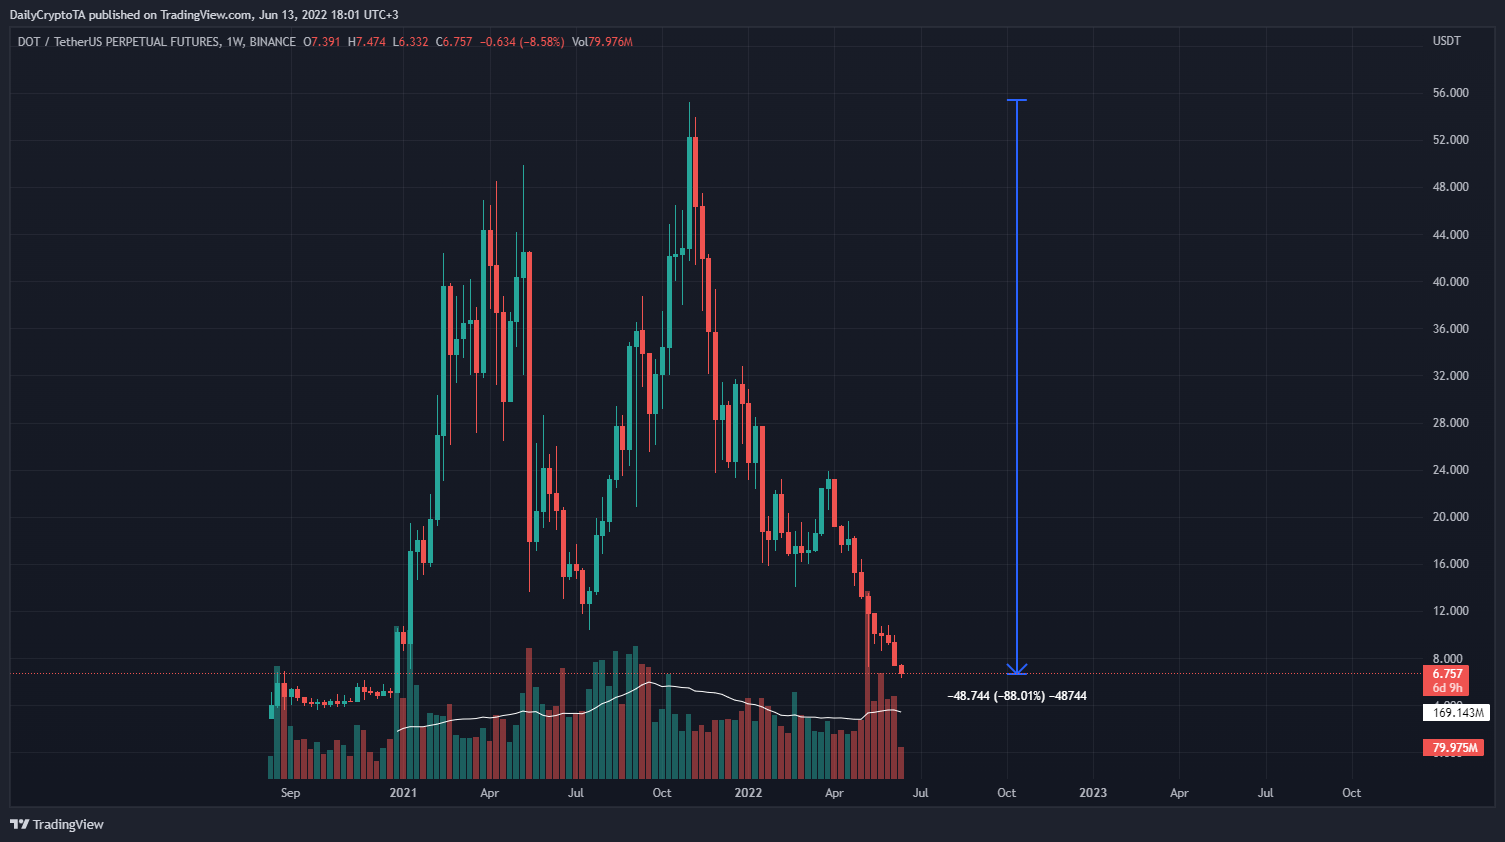
The market trend of digital currencies follows the laws of the financial markets closely. Both react according to the market’s supply-and-demand relationship and the macro and micro environmental influences, with each individual crypto-asset similar to a stock in the traditional financial markets. They each have their respective characteristics and supporting value propositions. Therefore, investors can form a more accurate forecast of market conditions by assessing market trends, news, fundamental and technical analysis based on available data.
This article will briefly describe the basic concepts, characteristics, and use of the Moving Average Convergence Divergence (MACD) for investors.
What is MACD?
The MACD indicator is made up of a fast moving average (red line) and a slow moving average (yellow line). By calculating the difference between the fast and slow averages, it is displayed as an indicator for investors to refer to and judge current market trends. On MEXC, the MACD is shown as two thin red and yellow lines. MACD is not sensitive to small fluctuations in the short-term market, so it can filter out short-term market information and accurately predict the market trend in long–term investment.
Advantages and disadvantages of MACD
Advantages: The advantage of MACD is that it can automatically define the current market trend, avoiding the dangers associated with operating against the market. It allows complete prediction of the start and end of market uptrends and downtrends in the medium and long term, mitigating market noise for investors.
Disadvantages: MACD is a robust medium to long term indicator. Hence, it is not very sensitive to drastic changes in the market and frequent occurrence of market signals, and is therefore not suitable for high frequency trading.
Example of using MACD
Unlike the Moving Average (MA), which can be used in conjunction with the candlestick pattern to analyse the market situation, the MACD is formed by filtering out the noise of frequent market fluctuations and therefore focuses more on the analysis and prediction of its own pattern.
The “Golden Cross” and “Death Cross” of the MACD Indicator
Generally speaking, the robust and insensitive characteristics of MACD mean that the two lines do not cross often. Whenever the two lines do cross, it marks the arrival of extremely volatile market conditions. Therefore, cross-analysis combined with other indices can form reference information for investment behavior.
Golden Cross
When the fast moving average (red) crosses the slow moving average (yellow) upwards, the cross formed by the two lines is a golden cross, which is generally considered to be a positive sign of the market trend.
Death Cross
When the fast moving average (red) crosses the slow moving average (yellow) downwards, the death cross is formed, and is generally considered to be the mark of a downward trend.
The top and bottom divergences of the MACD indicator:

During regular market operations, asset prices fluctuate due to normal volatility. While asset prices and moving averages tend to move together, the MACD may not follow the price trend of the asset due to its lower sensitivity to volatility.
This results in a deviation between the MACD indicator and the asset price, with the MACD appearing to move in the opposite direction of the current trend.
Top divergence: when the MACD appears to be in a downtrend despite the candlestick chart moving in an uptrend, this phenomenon is called a top divergence. This means that the rise in price lacks support from the underlying trading volume, suggesting a potential large-scale significant downward movement. The higher the degree of divergence, the greater the expected market volatility.
Bottom divergence: when the MACD appears to be in an uptrend despite the market prices falling sharply, this is called a bottom divergence. This usually indicates an upward movement, and the higher the divergence, the more volatile the expected market volatility.
Summary
The MACD is a relatively common investment tool and has relatively important significance in the development of medium to long-term investment strategies. However, it is not sensitive to short-term market fluctuations or sudden market conditions. Therefore, when using the MACD as an investment reference, it is also necessary to be aware of the current news, market sentiment and short-term technical indicators.
Join MEXC and Start Trading Today!


