Technical analysis is a popular method used by traders to forecast future price movements in financial markets. One of the most widely used technical analysis patterns is the double bottom pattern. This pattern can be a profitable trading opportunity if traders understand how to identify it and develop an effective trading strategy around it. In this article, we will discuss what a double bottom pattern is, how to identify it, and the trading strategies associated with it.
What is a Double Bottom Pattern?
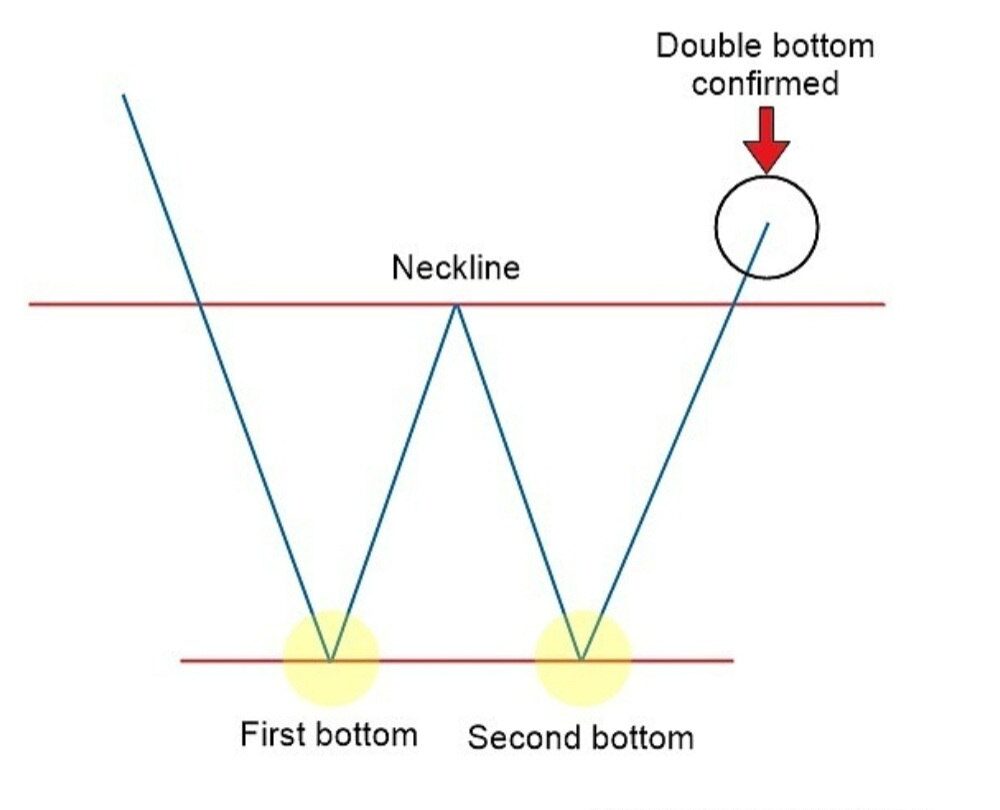
A double bottom pattern is a bullish reversal pattern that forms after a prolonged downtrend. This pattern is formed when the price of an asset falls to a certain level, then bounces back up, and then falls again to the same level as the first bottom. This forms a “W” shape pattern on the chart.
Characteristics of a double bottom pattern The double bottom pattern is characterized by the following features:
- The two bottoms are formed at approximately the same level.
- The time between the two bottoms should be at least one month.
- The volume should be higher on the second bottom than the first.
How to Identify a Double Bottom Pattern?
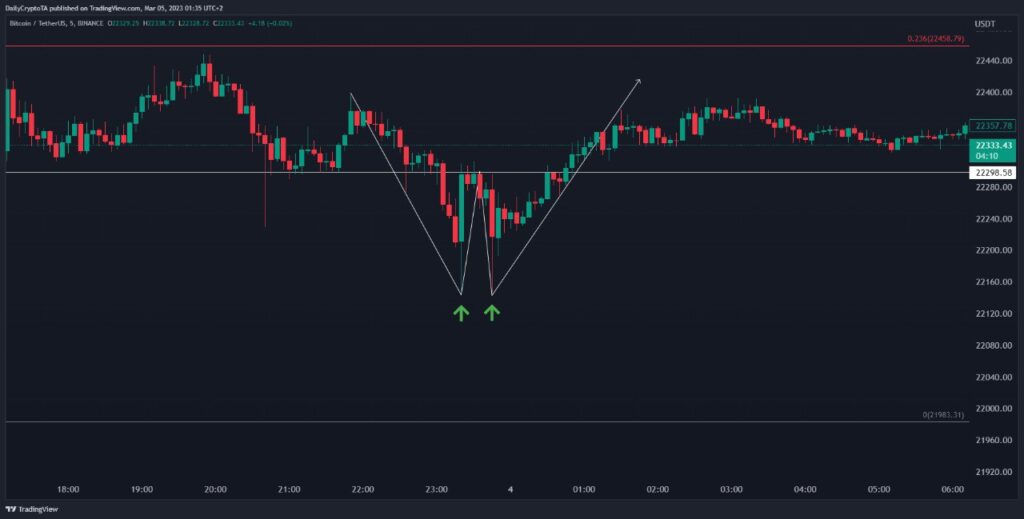
Using price action Traders can identify a double bottom pattern by studying price action. They should look for two lows at approximately the same level, separated by a peak in between. The price should then break through the peak to confirm the pattern.
Using technical indicators can also be used to identify a double bottom pattern. The most commonly used indicators are the Relative Strength Index (RSI) and the Moving Average Convergence Divergence (MACD). A bullish crossover on the MACD or an oversold reading on the RSI can indicate a potential double-bottom pattern.
Trading Strategies Using the Double Bottom Pattern
Bullish Reversal
The most common trading strategy using the double-bottom pattern is a bullish reversal. Traders should wait for the price to break above the peak between the two bottoms before entering a long position. The stop-loss can be placed below the second bottom, and the take-profit can be set at the next resistance level.
Continuation Pattern
The double bottom pattern can also act as a continuation pattern in an ongoing uptrend. Traders should wait for the price to break above the peak between the two bottoms and then enter a long position. The stop-loss can be placed below the second bottom, and the take-profit can be set at the next resistance level.
Entry and Exit Strategies
Entry Strategies
Traders can enter a long position once the price breaks above the peak between the two bottoms. They can also wait for a confirmation candle to form after the breakout to reduce the risk of a false breakout.
Exit Strategies
Traders should consider exiting a long position if the price falls below the second bottom or if the price fails to break above the peak between the two bottoms. They can also consider taking partial profits at key resistance levels.
Risk Management
Traders should always consider risk management when trading the double bottom pattern. They should place stop-loss orders to limit their losses in case the trade goes against them. The risk-reward ratio should also be considered when setting take-profit levels.
Conclusion
The double bottom pattern is a popular technical analysis pattern that identifies potential trading opportunities. Traders can use various methods to identify the pattern, including price action and technical indicators. The pattern can be used for both bullish reversals and continuation patterns. However, traders should always consider risk management when trading this pattern.
FAQs
Q1. Is the double bottom pattern only applicable to a specific market?
A. No, the double bottom pattern is applicable in any financial market, including stocks, forex, and commodities.
Q2. Can the double bottom pattern be a bearish reversal pattern?
A. No, the double bottom pattern is a bullish reversal pattern. A similar bearish reversal pattern is called the double-top pattern.
Q3. How long should the time between the two bottoms be?
A. The time between the two bottoms should be at least one month.
Q4. What is the minimum volume required for a double-bottom pattern?
A. The volume should be higher on the second bottom than the first.
Q5. Can the double bottom pattern be used for day trading?
A. Yes, the double bottom pattern is usable for day trading, but traders should consider the timeframes and overall market conditions before entering a trade.
SOCIALS:
Personal Note From MEXC Team
Check out our MEXC trading page and find out what we have to offer! You can learn more about crypto industry news. There are also a ton of interesting articles to get you up to speed with the crypto world. Lastly, join our MEXC Creators project and share your opinion about everything crypto! Happy trading!
Join MEXC and Start Trading Today!


