We at MEXC are always looking at ways to ensure how we can help the community grow and that too in a profitable and sustainable manner. Novice traders feel the brunt of this the most as they end up losing initially and lose the courage to trade further.
Just to make the initial journey a fruitful and smooth one, here are some basic indicators which will help every trader up their crypto trading game. We touch upon the basics and advise our readers to go in-depth about each to make sure they understand and execute these indicators in the best way possible. Let’s get going, first, we begin with Moving Average.
What is a Moving average (MA)?
Moving average is a simple yet powerful tool for analysing the direction and strength of a trend. It does that by considering price data for a specific period of time to then formulate an average
Multiple types of Moving Averages are used by traders for intraday or positional trades along with long term investing. Simple Moving Average (SMA) and Exponential Moving Average (EMA) are the two most widely used moving averages of all time.
How to read Moving Average?
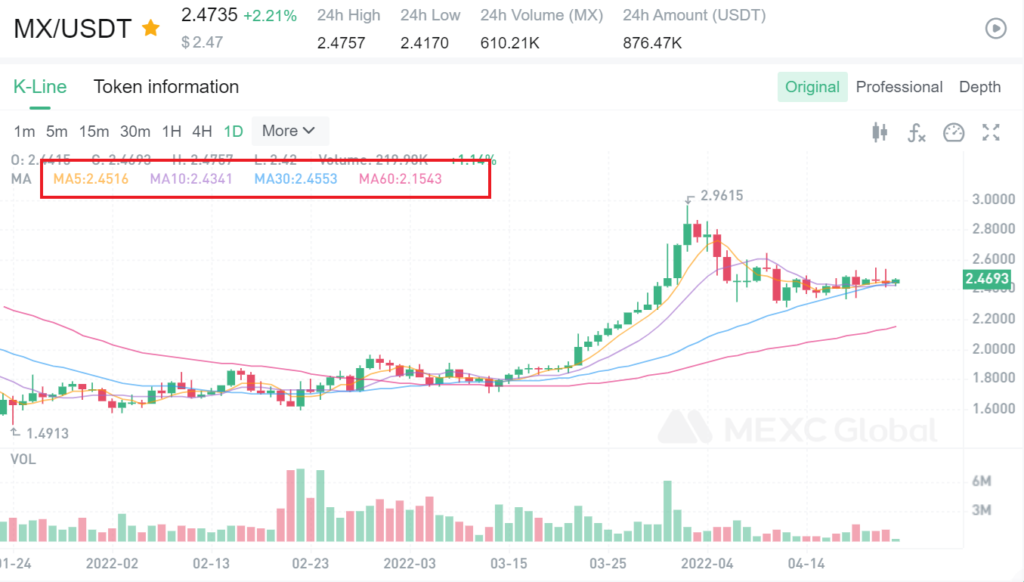
Moving average analyses the days entered for reading and defining itself. Higher the number of days, the slower the reaction of the moving average in providing the new data set for analysis. Moving averages are purely dependent on previous price actions. This data is represented via a line on the charts and any movement, above or below the lines is considered the most important trading signal for decision making. Traditionally 50,100 & 200 days are the most used moving averages.
If the dataset includes 200 days, the moving average will continuously update itself to include data from the past 200 days. For every trader, it is really important to evaluate and select the type of moving average based on their personal analysis.
The simple logic that traders need to remember is, the larger the data set, the more beneficial for long term investing as such trades will not be immensely affected by general days volatility
For short term traders, a smaller data set is advisable as it is more volatile and reactive and helps in making quick decisions.
Crypto markets are open throughout the day and because of this, we advise traders to read more about moving averages in detail before using them for their crypto trades.
What is the Ichimoku Cloud?

This indicator is one of the best for determining the resistance and support levels along with the direction of the trend. It’s a complex and confusing looking indicator however users find its practical application to be one of the most useful and simplistic.
Ichimoku cloud mainly consists of 5 lines which are the main indicators to be read:
- Tenkan-sen: This line indicates the average price value for the first time period, which is the sum of maximum and minimum for that particular period of time, divided by two;
- Kijun-sen: indicates the average price for the second time period;
- Senkou Span A: indicates the centre of the distance between the previous two lines, moved forward by the value of the second time interval;
- Senkou Span B: indicates the average price value for the third time interval moved forward by the value of the second time interval;
- Chinkou Span: indicates the closing price of the current chart candle, moved backwards by the value of the second time interval.
How to read Ichimoku Cloud?
The Ichimoku cloud in itself can be defined as the distance between the Senkou lines A & B.
If the price ranges between these lines, the market is considered to be less volatile and not in trend, while the edges of the cloud form support and resistance levels. This can be considered a good time to enter a trade in the margin or spot trading. Many traders go long and short within the range of the cloud.
In cases when the price crosses over the cloud, the first upper line then becomes the first support level and passing which the second line becomes the second support level. This is where most traders enter long positions.
That is, from the upper line you (always!) can expect to enter the long position (on the rebound). Don’t forget about stop-loss orders, as there could be breakdowns and steep drops in price.
What is Trading Volume?
Trading Volume is undoubtedly one of the underestimated yet powerful indicators in all of the trading world. It’s a direct indication of how many people are buying and selling the said asset.

How to read Trading Volume?
The higher the volume higher is the conviction. Similarly, the lower the volume lower the buyers and hence lower is the conviction.
Volume is defined by red and green candles showed at the bottom of the indicator. Consecutively towering green candles indicate buying momentum, same with red towering candles defining higher selling.
Trading volume acts as the base indicator and all other indicators use trading volume to higher their conviction on any trade.
If there is a significant price movement in a certain direction, there should also be an “impulse” of the movement, behind which there is a sufficient number of people.
How to use the above indicators on MEXC?
Go to token charts, press professional on the top right of the chart, press on fx below professional to search for the required indicator and apply it to the charts to start reading it.
Join MEXC and Start Trading Today!


