Hi! It’s TraderSimon, founder of tradersimon.com! I’m delighted to join the MEXC Creators project. My articles will help you boost your technical trading knowledge! In the first article, we’re going to look at Supply & Demand zones. You’ll learn what they are, why they are so useful and how to trade them with crypto currencies. Hopefully, you’ll find these are an excellent addition to your trading toolbox.
What Exactly Are Supply & Demand Zones?
Supply and Demand zones are areas on a chart that indicate a large amount of professional buying or selling has taken place at a given price level. By “professionals”, we’re talking about institutions or Whales with very large pockets and enough firepower to move the market very quickly.
Demand Zones
When a Demand zone is formed, it typically starts with a small consolidation base and then a fast, impulsive move up. This indicates that there was a lot of buying interest (or demand) at the base.
Now, as the market moved so quickly, you can bet that not all orders would have been filled. So when the market eventually returns to that zone, there’s a good chance that more buy orders will be filled and it will move up again.
Let’s look at a Demand zone on a Bitcoin (BTC/USDT) chart to see exactly what I mean:
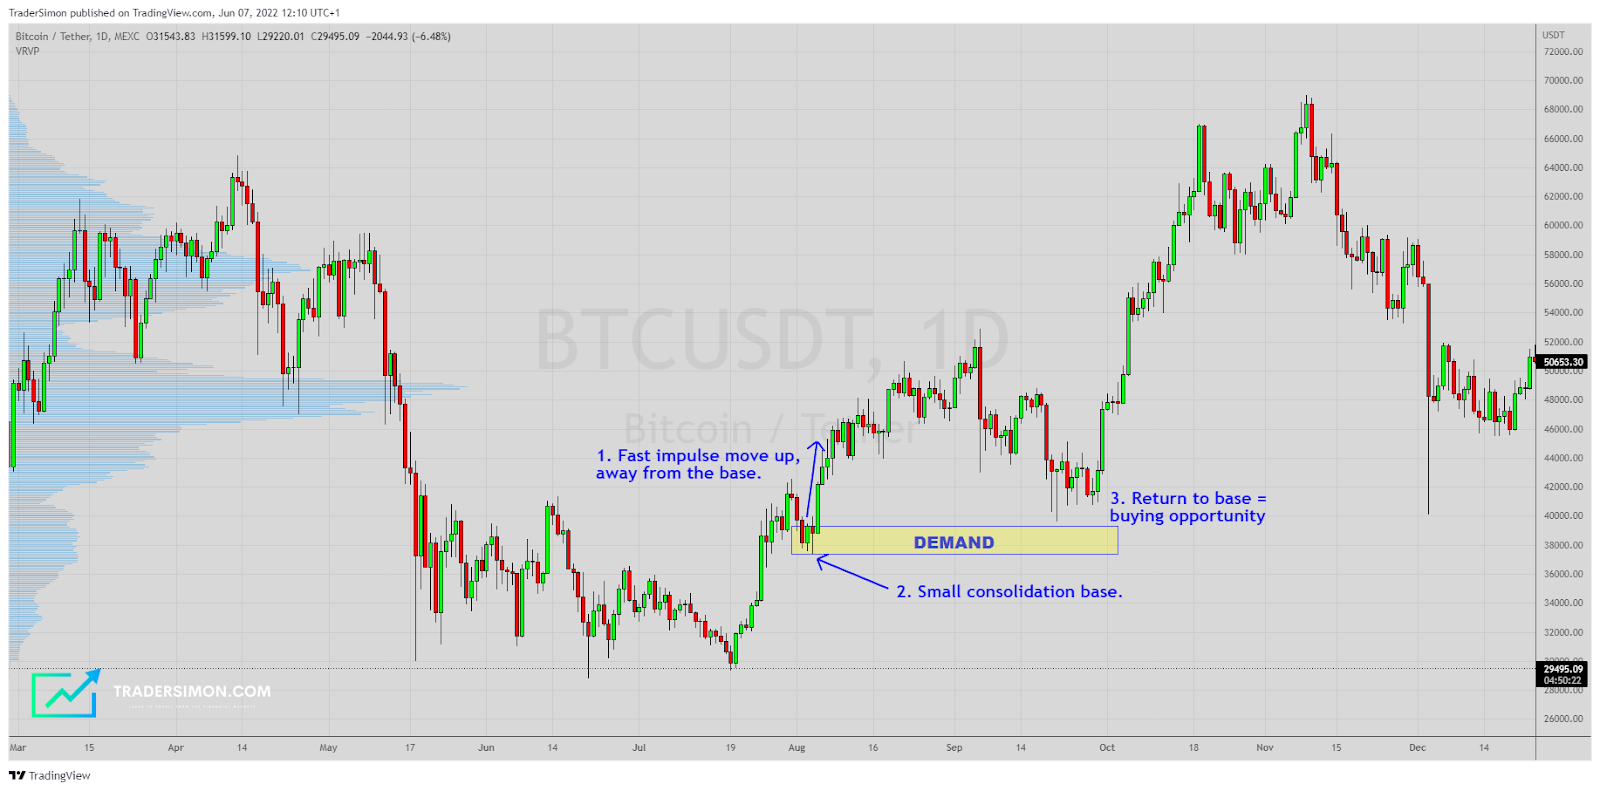
Contrary to what other trading mentors may have told you, the first thing to look for is the impulse move. Without a fast impulsive move, there is no zone.
When we see this fast move away from a consolidation area in just a few candles, it tells us there is big money involved.
Now let’s look for the base of the zone.
The upper side of the base starts at the exact point where the market shot up and the lower side of the base will be the low of the consolidation area.
When the market comes back for a 2nd time to the zone, there’s a very good chance that the whales will buy here again, giving us an opportunity to join them.
Your trade entry would be at the top of the base and your stoploss would be below the low of the base.
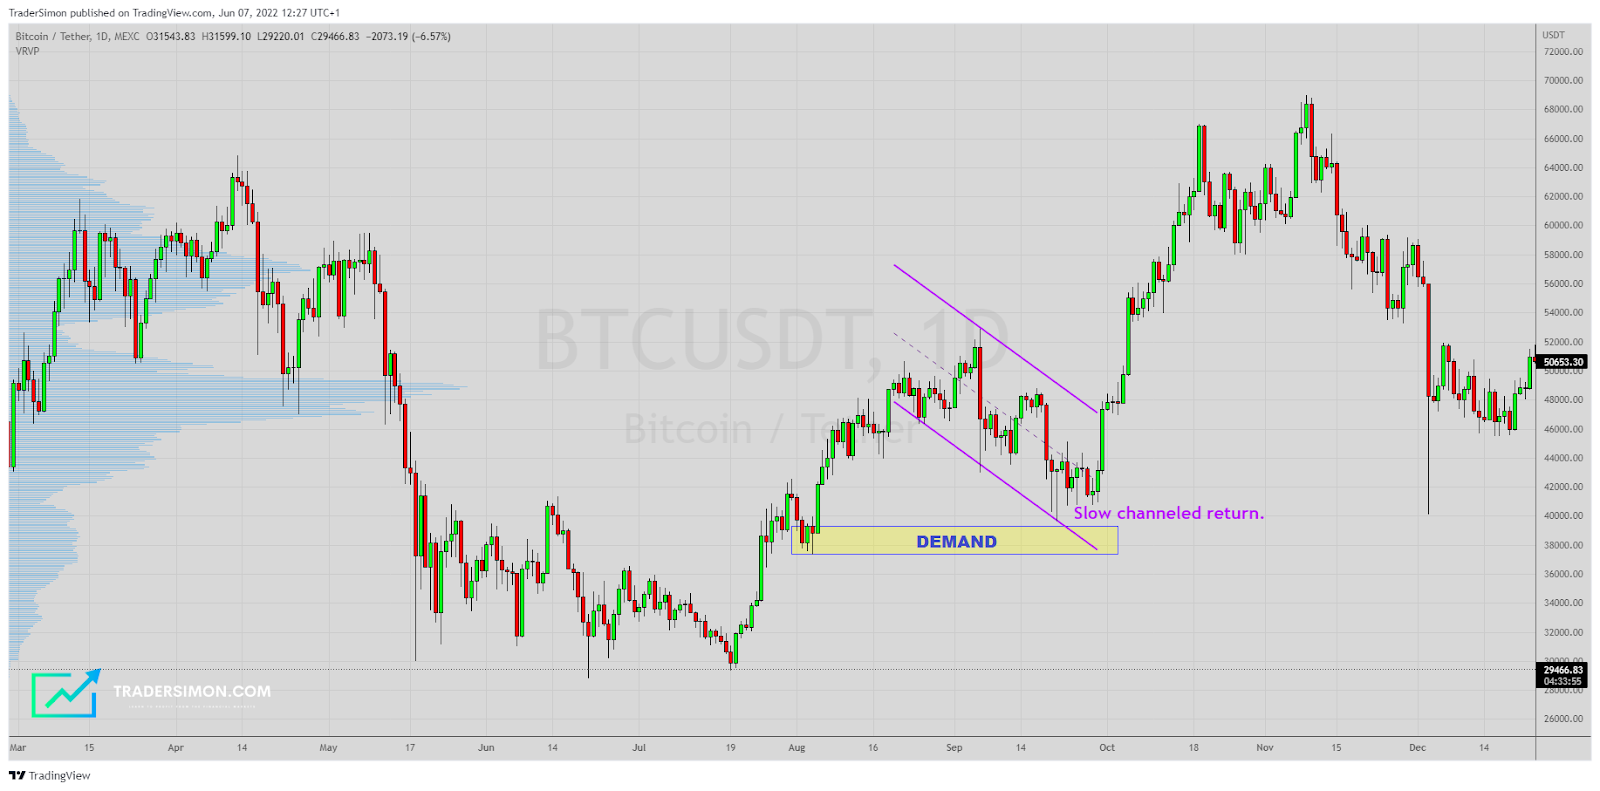
Now, it’s important to note that not all zones are going to work and there are many factors involved to stack the odds in your favour.
One factor that can enhance your odds is by looking at the type of return to the zone. When the market makes a slow channelled or rounded return back to the zone, it’s far more likely to work than if the market had immediately returned.
Did you notice the channelled return on the previous chart? I’ve drawn it here for you:
Supply Zones
OK, let’s look at a Supply zone now. Supply zones are the exact opposite to Demand. Find an impulsive move down, identify the base and then sell the return to the zone. Here’s an example on a 1 hour Ethereum (ETH/USDT) chart:
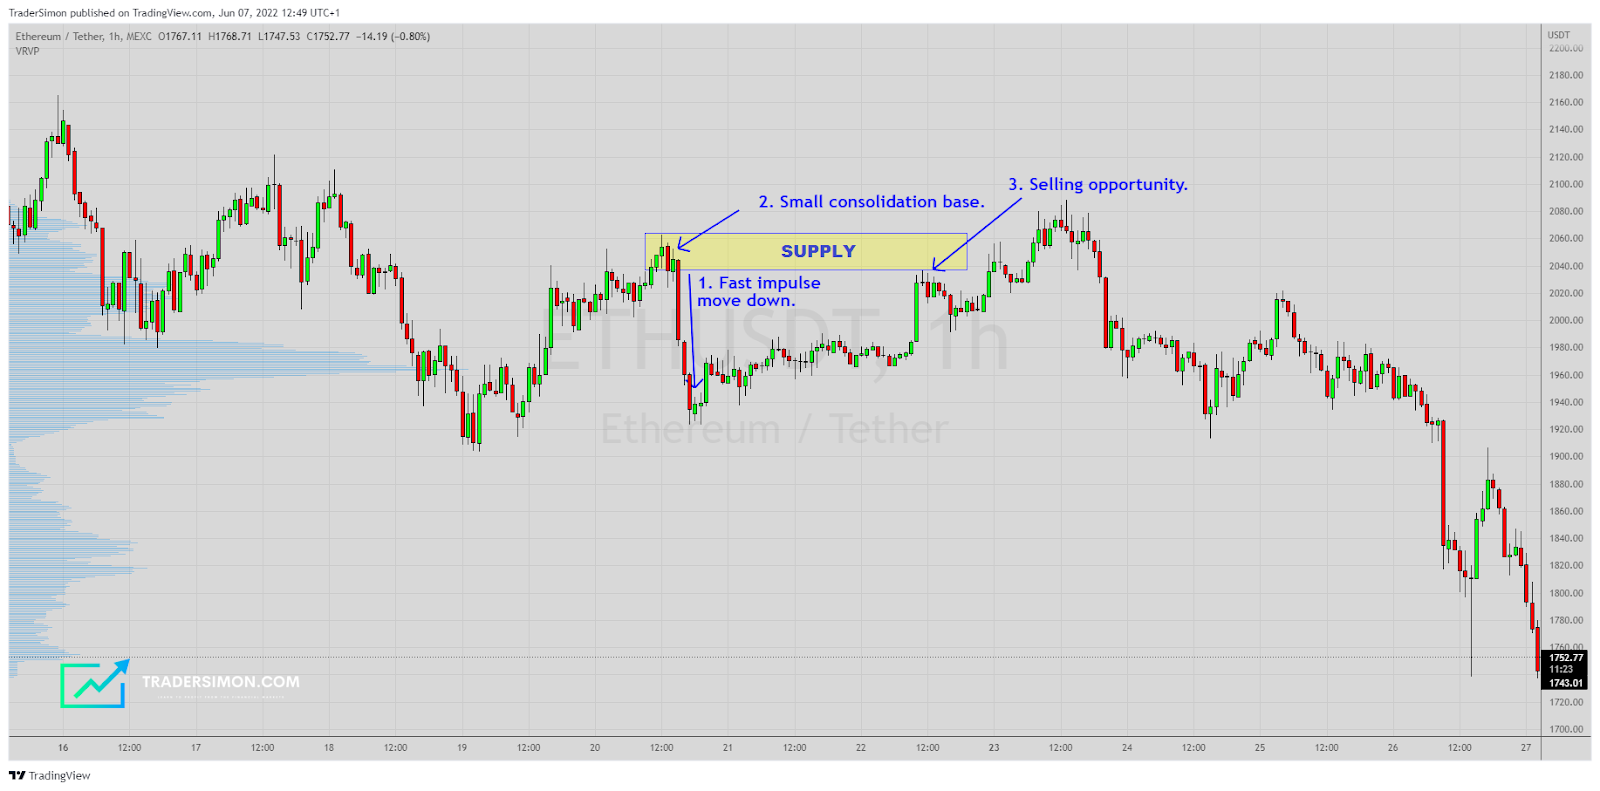
To keep it real, I’ve found an example where the market didn’t move that far, but still would have given a profitable trade.
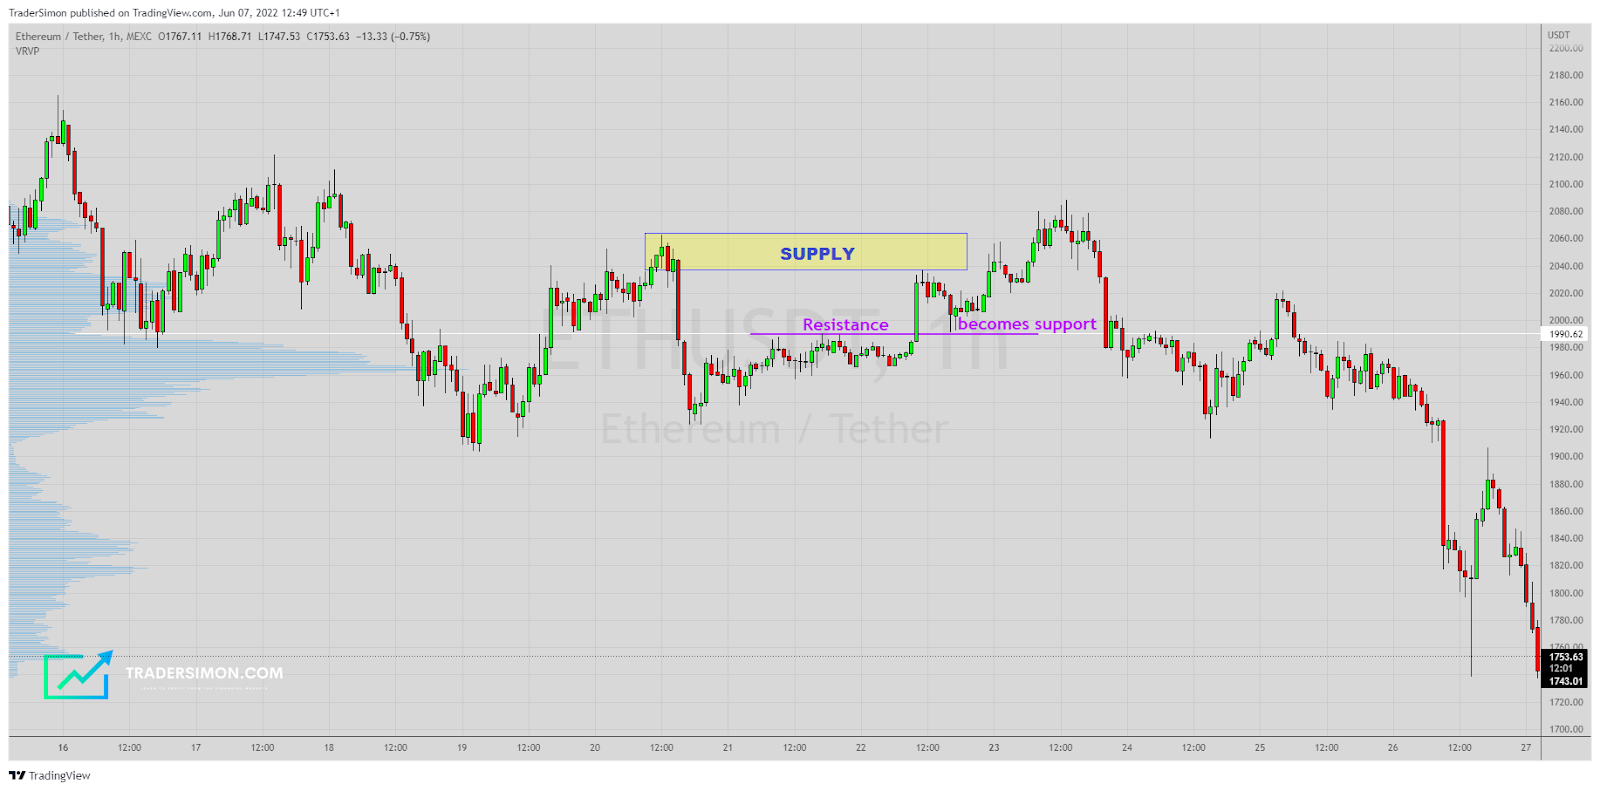
Can you see why the market turned back up again, after the initial drop from Supply?
Look again closely at the chart below – there’s a support level in the way. In fact, if you project the purple line to the left and right (as indicated by the white line), you have what we call a Price Pivot Zone. This is a very powerful level that will repel the market from both sides.
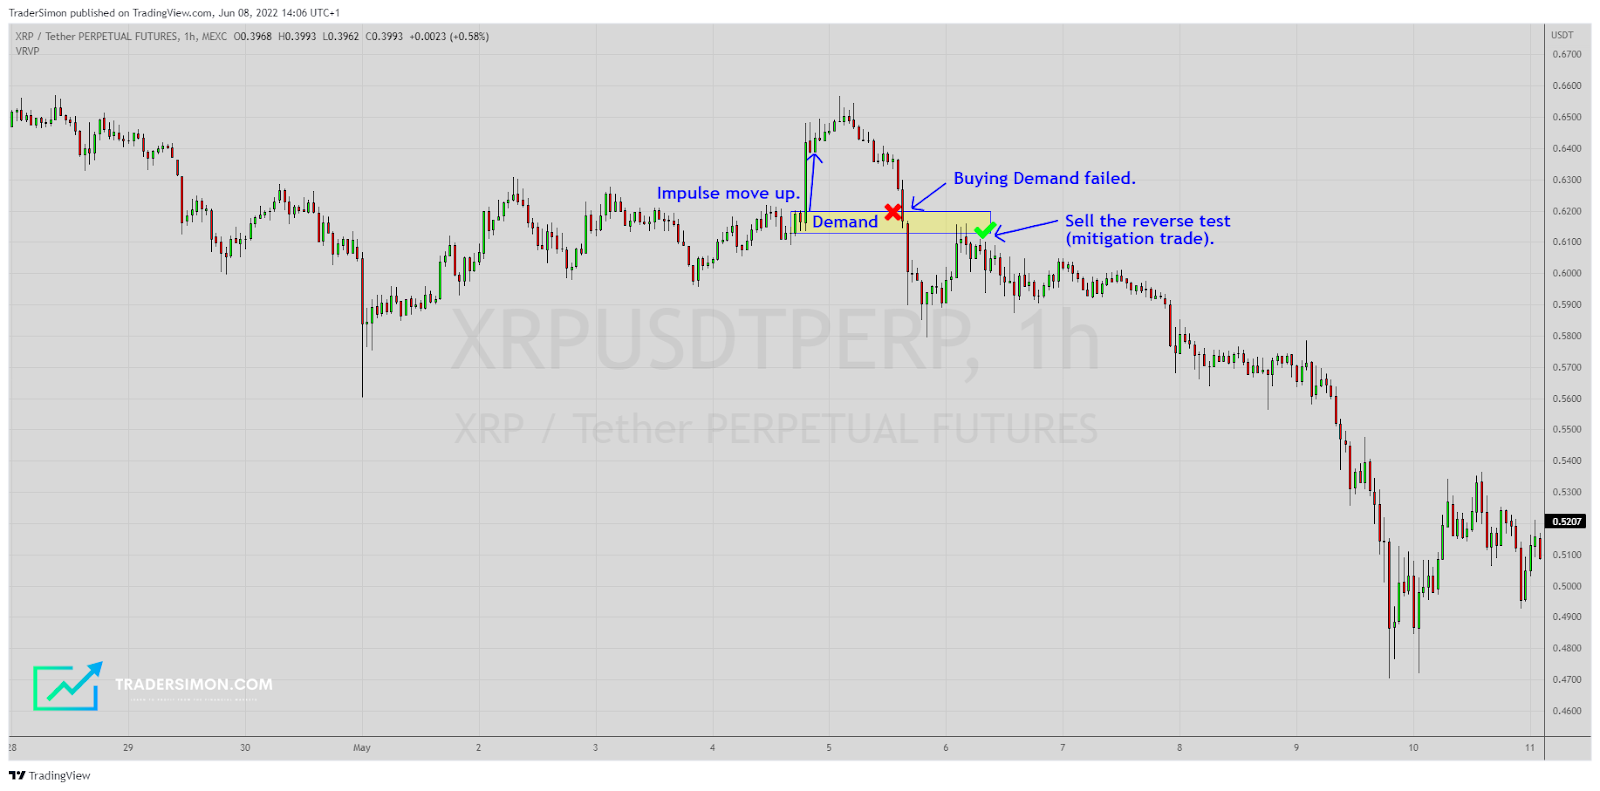
Finally, let’s see what often happens when a Supply or Demand zone fails.
In this 15 min Ripple Perpetual Futures chart, we see the Demand zone failed. Not to worry, because the market will often retest the opposite side of the zone, giving an opportunity to go short and recoup a profit. This is known as a Mitigation trade.
I hope you’ve enjoyed this article. We’ve only just skimmed the surface on trading strategy, so if you want to learn more, head over to my website or wait for the upcoming articles here!
Join MEXC and Start Trading Today!


