
Understanding various strategies and patterns is crucial for achieving profits and managing risks better in crypto trading. One of the most common patterns used in the crypto market is the diamond pattern.
The diamond pattern is an effective trading pattern for interpreting market movements. Diamond charts have the potential to assist traders in designing optimal crypto trading strategies.
Now the question is, how effective is this pattern, and how can you use the diamond pattern in crypto trading? Find the answer in this article!
What is the Diamond Pattern?
The diamond pattern is a sign that typically appears near the peak of market price movements. The term “diamond” itself comes from its shape, resembling a diamond formed by trend lines connecting the highest and lowest prices.
Diamond pattern formation involves identifying heads and shoulders that are not in the center of the chart, usually followed by drawing trend lines based on the peaks and valleys formed.
The diamond chart itself is a rare pattern, but when it occurs, it can be a strong indication that an ongoing upward trend may be coming to an end.
This pattern can be observed when prices, previously in an upward trend, start moving sideways for a certain period, forming a diamond-like pattern. Once the pattern is formed, it becomes an indicator of a potential trend reversal.
Diamond Chart Patterns Types
Diamond charts are robust patterns and can be used to interpret both bearish and bullish conditions;
Bullish Diamond
The Bullish Diamond pattern is a pattern that depicts a scenario opposite to the previous pattern. This diamond chart type usually appears during a strong downtrend in the market.
A bullish chart is characterized by a downtrend followed by a stability period forming peaks and valleys at the base of the pattern.
To confirm a bullish diamond pattern, four trend lines are drawn around its structure. If these lines are almost equal in length and form a diamond, the structure can be recognized as a bullish trend.
Bearish Diamond
The bearish diamond pattern is a trend reversal pattern that can help detect price momentum when reaching resistance levels. This pattern is commonly used to understand resistance lines.
Typically, the pattern forms when the asset price approaches the resistance trend line, which can result in a sudden change in price direction. However, there are situations where the price breaks through the resistance trend line and continues its upward movement.
This pattern appears at the end of an upward trend and provides a strong signal of a trend reversal, often resembling the head and shoulders pattern.
Is the Diamond Chart Accurate?
Diamond patterns in technical analysis provide a method for predicting price movements in the financial market, but the accuracy of this pattern cannot be guaranteed entirely.
Like other technical analysis tools, this chart also has limitations in consistency and price prediction. Some important factors, such as market conditions and trends, can affect the accuracy of this pattern.
Implementing the diamond pattern strategy with wise risk management and confirming first with other indicators or additional charts is the key to its main success. Setting stop-loss and take-profit levels should be well-planned to minimize risks.
How to Read the Diamond Pattern
Before understanding how to use diamond patterns in crypto trading, it is recommended to first understand how to read the diamond pattern. This pattern in technical analysis requires an understanding of its characteristics and the signals it provides.
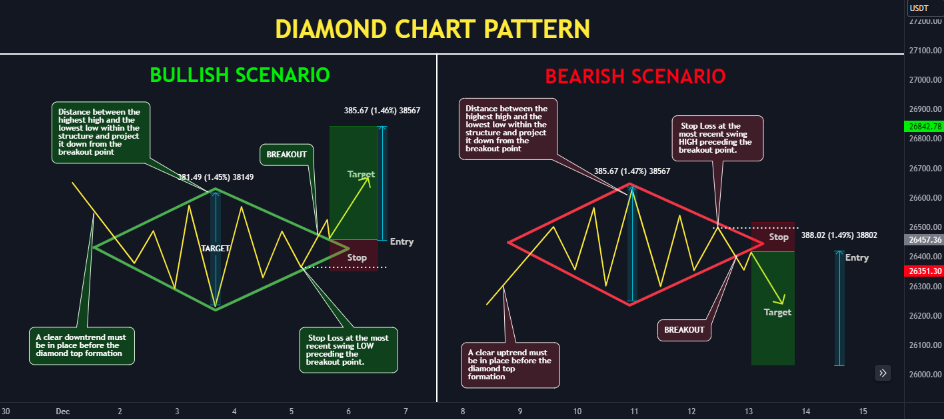
As we can see in the chart created by QuantVue on TradingView above, it explains how to read the diamond pattern to identify bullish or bearish trends.
Now, here are the steps that can be used as a reference in reading it:
1. Identify the Previous Trend
The first step is to identify the market trend. The diamond pattern is an indicator of a trend reversal, so knowing the previous trend direction is important to correctly identify accurate signals.
2. Understand the Formation Phase
This pattern also involves four main phases: peak formation, valley formation, lower peak formation, and higher valley formation. Knowing which phase is occurring can help traders understand the formation signals.
3. Confirm with Other Indicators
As an additional step, confirm signals using other technical indicators. For example, check for divergence or convergence conditions with some indicators, such as MACD (Moving Average Convergence Divergence) and RSI (Relative Strength Index).
4. Confirm Breakout
The main signal on this chart is a breakout, where the price breaks through one of the trend lines forming the pattern. Wait for breakout confirmation before taking action, as false breakouts may occur.
5. Correction and Evaluation
When the breakout occurs, make sure to monitor price movements to see if the pattern continues as predicted or undergoes correction.
6. Pay Attention to Volume
Trading volume is also crucial in reading this pattern. Breakouts supported by high volume tend to be more convincing than those with lower volume.
How to Use the Diamond Pattern for Crypto Trading
Using the diamond pattern for crypto trading is not too difficult. Why? Because, as traders, you only need to determine entry levels, set stop-loss points, and target profits.
Here is a diamond pattern strategy that can be used in crypto trading:
Determine Entry Point
This pattern usually indicates a potential reversal in both bullish and bearish conditions. Therefore, sell or buy positions can be determined based on where this pattern appears.
Place a sell position if a bearish pattern forms at the end of an uptrend or place a buy position if a bullish pattern forms at the end of a downtrend.
Determine Stop-Loss Point
Pay attention to the stop-loss point as it will minimize potential losses. For the stop-loss level, it can be placed in some areas. You can place a stop-loss above the bearish diamond if entering a sell position or place a stop-loss below the bullish diamond if entering a buy position.
Determine Target Profit
Setting a target profit with this pattern is relatively easy compared to others. Mostly, some experienced traders will set profit heights parallel to the height of the diamond pattern itself. However, one of the most ideal methods is to set a fixed risk-to-reward ratio.
Conclusion
The diamond pattern, as one of the patterns in technical analysis, contributes to identifying potential changes in market trends. Understanding this pattern is crucial to minimize risks and maximize profit potential.
Besides, it’s also essential to remember that the diamond pattern is not always accurate. Therefore, confirming signals with various additional indicators and implementing wise risk management is a crucial step in crypto trading.
Personal Note From MEXC Team
Check out our MEXC trading page and find out what we have to offer! There are also a ton of interesting articles to get you up to speed with the crypto world. Lastly, join our MEXC Creators project and share your opinion about everything crypto! Happy trading! Learn about interoperability now!
Join MEXC and Start Trading Today!

 Listing with Massive 149,000 USDT Prize Pool")

