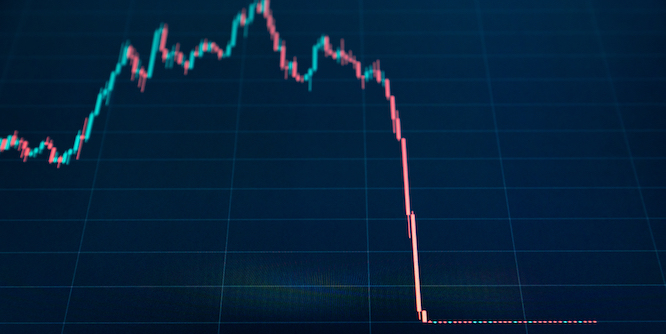
Bitcoin plunged to $86,325 on November 20—its lowest level since April and a staggering 32% decline from October’s all-time high above $126,000. The cryptocurrency has now erased all of its 2025 gains, with the broader crypto market shedding approximately $1.2 trillion in value over the past six weeks.
The Fear & Greed Index has collapsed to 11, signaling “Extreme Fear” not seen since the depths of previous bear markets. Spot Bitcoin ETFs have hemorrhaged $3.7 billion in outflows since October 10, with a single-day withdrawal of $869 million on November 14 marking the second-largest outflow on record.
Yet amid the carnage, institutional divergence is emerging: Harvard University tripled its Bitcoin ETF holdings to $443 million via BlackRock’s IBIT, while long-term holders remain largely inactive despite the drawdown. Is this the capitulation that precedes a bottom, or the beginning of something worse?

1.The Numbers Behind the Crash
1.1 Price Action
- Current price: ~$86,000–$87,000
- October ATH: $126,000
- Decline: 32% in 6 weeks
- 7-day change: -15%
- 2025 YTD: All gains erased
1.2 Market Impact
- Total crypto market cap: Down from $4.3 trillion to ~$3.1 trillion
- Value destroyed: $1.2 trillion in 6 weeks
- Bitcoin dominance: Holding ~52% as altcoins bleed harder
1.3 ETF Flows
- Total outflows since Oct 10: $3.7 billion
- Nov 14 single-day outflow: $869 million (second-largest ever)
- Grayscale Mini Trust: -$318 million (Nov 14)
- BlackRock IBIT: -$256 million (Nov 14)
- Fidelity FBTC: -$119 million (Nov 14)
1.4 Sentiment
- Fear & Greed Index: 11 (Extreme Fear)
- Bullish sentiment: Dropped from 82% to 40%
- VIX (stock volatility): Up 10% on Tuesday

2.What Triggered the Selloff?
Multiple factors converged to transform October’s euphoria into November’s panic:
2.1 Stronger-Than-Expected Jobs Data
The U.S. economy added 119,000 jobs in September—well above the 50,000 economists expected. This data, released amid the selloff, raised questions about whether the Federal Reserve would proceed with a December rate cut. According to CME’s FedWatch tool, the probability of a December cut dropped to approximately 40% following the report.
Higher-for-longer interest rates reduce the appeal of risk assets like Bitcoin, which generates no yield and competes with Treasury bonds offering 4%+ returns.
2.2 ETF Outflow Cascade
The $3.7 billion in ETF outflows since October represents a dramatic reversal from the inflows that fueled Bitcoin’s rally to $126,000. Institutional investors who piled in during the summer are now reducing exposure, creating sustained selling pressure that has overwhelmed buy-side demand.
The concentrated nature of outflows—with Grayscale, BlackRock, and Fidelity all seeing significant withdrawals simultaneously—suggests coordinated risk reduction rather than isolated profit-taking.
2.3 Broader Risk-Off Sentiment
Bitcoin’s crash coincides with weakness across risk assets. The S&P 500 posted its longest losing streak since August, the tech-heavy Nasdaq shed $2.6 trillion from its October peak, and CNN’s Fear & Greed index for stocks fell to its lowest since early April.
“Bitcoin’s pullback is part of a broader shift in risk sentiment,” noted Haider Rafique, global managing partner at OKX. Crypto is not trading in isolation—it’s moving in lockstep with Nasdaq and other high-beta assets.
2.4 Listed Company Bitcoin Holdings Underwater
Standard Chartered estimates that a sustained drop below $90,000 would leave half of publicly traded companies’ Bitcoin holdings “underwater”—worth less than their purchase price. With listed companies holding 4% of all Bitcoin in circulation, this creates potential for forced selling if corporate treasuries face margin calls or liquidity requirements.

3.Technical Analysis: Key Support Levels
Bitcoin’s technical picture has deteriorated significantly, but key support levels remain intact:
3.1 Critical Support: $85,000–$86,000
Bitcoin is currently testing this zone, which represents:
- The April 2025 support level
- Significant whale accumulation zone
- Psychological round number
- Long-term holder cost basis for Q1 2025 buyers
A daily close below $85,000 would be technically bearish and could trigger accelerated selling toward lower support.
3.2 Major Support: $75,000–$82,000
If $85,000 fails, the next major support zone sits at $75,000–$82,000:
- April 2025 correction low: $74,500
- 50% Fibonacci retracement from cycle low to ATH
- Previous resistance-turned-support zone
Analysts at Standard Chartered and CryptoQuant have identified this range as the “maximum pain” scenario before structural buyers would likely emerge.
3.3 Resistance: $90,000–$92,000
For any recovery to gain credibility, Bitcoin must first reclaim $90,000 and establish it as support. The $92,000 level (6-12 month holder cost basis) represents the initial hurdle bulls must clear.
3.4 Bullish Invalidation: $100,000+
Only a weekly close above $100,000 would invalidate the bearish structure and signal the correction has ended. Until then, rallies should be treated as opportunities to reduce risk rather than add exposure.
4.Divergent Signals: Is This Capitulation?
Despite the panic, several metrics suggest this selloff differs from previous crypto winters:
4.1 Bullish Divergence
Institutional Accumulation Continues: Harvard University tripled its Bitcoin ETF holdings to $443 million via BlackRock’s IBIT even as prices crashed. While Wisconsin’s state pension fund liquidated its position, the divergence suggests sophisticated institutions view current prices as attractive rather than alarming.
Long-Term Holders Not Selling: On-chain data shows long-term holders (155+ days) remaining largely inactive during the drawdown. Short-term holders are capitulating—dumping 49,120 BTC at elevated rates—but the “smart money” cohort is holding firm.
No Systemic Failure: Unlike the FTX collapse (2022) or Terra/Luna implosion, no exchange has failed, no major protocol has been hacked, and no systemic risk has emerged. This is a leverage flush and sentiment correction, not an existential threat.
Extreme Fear = Historical Opportunity: Fear & Greed readings below 15 have historically preceded major bottoms. While not a timing tool, extreme fear indicates that weak hands have largely capitulated.
4.4 Bearish Concerns
ETF Outflows May Continue: The $3.7 billion in outflows may not be complete. If institutional redemptions continue, sustained selling pressure could overwhelm any accumulation.
Macro Uncertainty: Fed policy remains unclear, and a hawkish surprise at the December 9-10 FOMC meeting could trigger another leg lower.
Corporate Liquidation Risk: If Bitcoin stays below $90,000, companies holding BTC at higher cost bases may face pressure to sell—creating a potential cascade.
5.Trading Strategies for the Current Environment
5.1 For Active Traders
Don’t Catch Falling Knives: Wait for confirmation of support before adding long exposure. A daily close above $88,000 with follow-through volume would be the minimum signal that selling pressure is exhausting.
Define Risk Clearly: If trading the bounce, set stop-losses 3-5% below entry. The risk of another leg lower remains elevated until price reclaims $92,000.
Watch for Capitulation Candles: High-volume selloffs that close near their highs often signal exhaustion. Monitor for reversal patterns (hammer, bullish engulfing) at key support levels.
For Dollar-Cost Averagers:
Scale In Gradually: Rather than timing the exact bottom, allocate across the $86,000–$75,000 range over 2-4 weeks. Historical data shows that buying during extreme fear—while uncomfortable—has produced strong long-term returns.
Set Limit Orders: Place limit buy orders at key support levels ($85,000, $82,000, $75,000) to automatically accumulate during panic without emotional decision-making.
5.2 For Risk-Averse Investors
Wait for Confirmation: A weekly close above $95,000 would suggest the worst is over. Missing the exact bottom is acceptable if it means avoiding potential further downside.
Reduce Leverage: Now is not the time for leveraged positions. Volatility can spike in both directions, and liquidation cascades remain a risk until volatility normalizes.
6.Conclusion: Correction, Not Capitulation—Yet
Bitcoin’s 32% crash from its October high is painful but not unprecedented. The cryptocurrency experienced similar drawdowns in April 2025 (35%), August 2024 (26%), and March 2024 (22%)—each time recovering to make new highs.
What distinguishes this correction:
- ETF outflows unprecedented in scale and speed
- Macro environment genuinely uncertain (Fed, government shutdown)
- No systemic failure to justify panic
- Long-term holders remain committed
- Extreme Fear readings historically mark opportunity
The next 1-2 weeks will be critical. If Bitcoin holds $85,000 and begins building a base, the correction thesis remains intact. If $85,000 fails and corporate liquidations trigger a cascade, $75,000 or lower becomes realistic.
For traders, the message is clear: manage risk, don’t chase, and recognize that extreme fear creates opportunity for those with patience and discipline. The bull market may not be over—but it’s certainly being tested.
Trade Bitcoin on MEXC: Navigate volatility with MEXC’s comprehensive BTC trading tools including spot pairs, perpetual futures with up to 125x leverage, grid trading bots, and advanced risk management features (TP/SL, trailing stops). The current 0-Fee Fest promotion allows cost-efficient positioning during market dislocations.
Disclaimer:This content is for educational and reference purposes only and does not constitute any investment advice. Digital asset investments carry high risk. Please evaluate carefully and assume full responsibility for your own decisions.
Join MEXC and Get up to $10,000 Bonus!
Sign Up


