NVIDIA (NVDA) is currently trading near $186.25 with a market capitalization exceeding $4.58 trillion. As the company approaches its Fiscal Year 2026 close, investors are debating whether this valuation represents a speculative “Dot-com 2.0” peak or the early innings of an industrial revolution in computing.
Key Takeaways
- Valuation Reality: Unlike the profitless revenue of the 2000s dot-com era, NVIDIA trades on robust fundamentals, with a Forward P/E of ~30x adjusted for projected 66% growth.
- The Moat: The CUDA software ecosystem and the rapid ramp-up of Blackwell chips create a defensible “wide moat” against competitors like AMD.
- Price Targets: Median analyst consensus sits at $253, implying a 36% upside from current levels.
- Institutional Verdict: The “Bubble” thesis is largely debunked by free cash flow (FCF) generation; this is an infrastructure build-out phase, not a speculative mania.
Table of Contents
Market Position & Financial Health Snapshot
NVDA is financially robust, guiding for $170 billion in revenue for FY2026. With a gross margin exceeding 74% and net profit margins that dwarf historical tech hardware averages, the company’s valuation is supported by tangible cash flow, not just narrative.
At $186.25 per share, NVIDIA is not just selling chips; it is monetizing the world’s transition to accelerated computing. The “Bubble” argument often ignores the denominator in valuation ratios: Earnings.
FY2026 Key Metrics Analysis
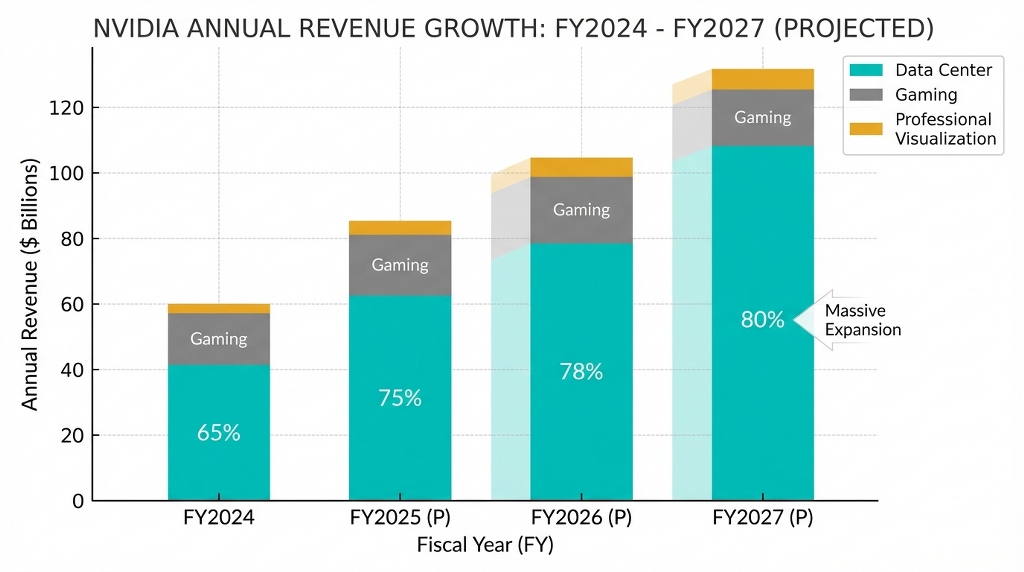
- Revenue Trajectory: The Data Center segment alone is growing at 93% YoY. This is not a one-off spike but a structural shift as hyperscalers (Microsoft, Meta, Google) re-architect their data centers.
- Profitability: NVDA boasts a Return on Equity (ROE) of 111%. This indicates exceptional management efficiency in converting shareholder equity into profit, a rarity for a company of this size.
- Liquidity: With average daily volume around 167 million shares, NVDA offers high liquidity for institutional entry and exit, reducing volatility risk compared to smaller cap AI plays.
Analyst Sentiment: Currently, 59 out of 64 major analysts maintain a “Buy” rating. The disconnect between the current price ($186) and the fair value estimates (up to $345) suggests the market has not fully priced in the longevity of the AI spending cycle.
Valuation Multiples: NVDA vs. Peers & History
While NVDA’s headline P/E of 46.13 appears high, its PEG ratio (Price/Earnings-to-Growth) remains attractive compared to peers like Broadcom and AMD. NVIDIA trades at a premium because it holds a monopoly-like status (80%+ market share) in AI training silicon.
To understand if this is a bubble, we must look at relative valuation. A high P/E ratio is justified if the earnings growth rate accelerates to match it.
Comparative Valuation Table (Jan 2026)
| Metric | NVIDIA (NVDA) | Broadcom (AVGO) | AMD (AMD) | Sector Interpretation |
| Price/Earnings (Normalized) | 45.98 | 51.58 | 62.15 | NVDA is cheaper than its main rivals relative to earnings. |
| Price/Sales (LTM) | 24.46 | 26.72 | 11.82 | High P/S reflects high margins; NVDA retains pricing power. |
| Return on Equity (ROE) | 111.04% | 46.63% | 7.61% | NVDA is significantly more efficient at generating profit. |
| Forward Revenue Growth | 66% | 12% | 18% | NVDA is growing 3x-5x faster than the competition. |
The “Bubble” Refutation: During the 2000 Dot-com peak, companies like Cisco traded at 100x earnings with slowing growth. NVDA trades at ~46x earnings with accelerating growth. The mathematics do not support the “Bubble 2.0” comparison.
The Bull Case: Why This Is a Generational Opportunity
The investment thesis for NVDA rests on the “Blackwell Supercycle” and the upcoming “Rubin” architecture. As Sovereign AI (nations building their own AI clouds) gains traction, demand is diversifying beyond just US Tech Giants, creating a multi-year revenue tailwind.
Catalysts Driving the Stock to $253+
- The Blackwell Ramp: Supply constraints for the Blackwell series are easing, which will unlock recognized revenue in Q1 and Q2 of 2026.
- Sovereign AI: Countries like Japan, France, and UAE are investing billions in domestic AI infrastructure, becoming a new, massive customer tier for NVIDIA.
- Software as a Service (SaaS): NVIDIA is quietly building a recurrent revenue stream through NVIDIA AI Enterprise software, reducing reliance on pure hardware sales over the long term.
Quantitative Outlook: If NVIDIA hits the upper band of analyst estimates ($190B+ revenue in FY2027), the stock could realistically test $300 by late 2026, representing a 61% upside.
Risks & Investment Strategy
The primary risks to NVDA are geopolitical (China export controls) and customer concentration (top 4 customers accounting for ~40% of revenue). Investors should look for entry points near technical support at $140-$150 rather than chasing all-time highs.
Strategic Considerations
- Buying the Dips: The stock frequently corrects 10-15% during quiet periods between earnings calls. These are historically the most profitable entry zones.
- The “Digestion” Phase Risk: There is a valid concern that hyperscalers might pause spending to “digest” the chips they’ve bought. However, recent capex guidance from Meta and Microsoft suggests spending will increase, not decrease, in 2026.
- Diversification: While bullish on NVDA, prudent portfolio management suggests pairing it with broader semiconductor ETFs (like SOXX) to hedge against single-stock volatility.
Execute Your Strategy on MEXC
For traders looking to hedge their portfolio or capitalize on short-term volatility efficiently, MEXC offers advanced tools like NVDA Stock Futures and Spot xStocks without the need for traditional brokerage hurdles.
Conclusion: Verdict on the Valuation
NVDA is not in a bubble; it is in a “price discovery” phase for a new asset class. With a price target median of $253 and a dominant moat in the most important technology of the century, NVDA remains a core holding for growth portfolios.
NVIDIA has successfully transitioned from a gaming hardware company to the backbone of the global economy’s intelligence layer. While short-term volatility is expected at the $4.58T market cap level, the long-term fundamentals, driven by the Blackwell and Rubin architectures, point toward sustained growth.
Frequently Asked Questions (FAQ)
Is NVDA stock overvalued in 2026?
No. While the share price is high, the valuation multiples (P/E, PEG) have actually compressed because earnings are growing faster than the stock price. Based on intrinsic value models, shares are arguably undervalued by ~46%.
What is the price prediction for NVDA in 2027?
Analysts project sustained highs. If the current growth rate of 30-40% continues into 2027, median targets suggest the stock could stabilize above $300, driven by the launch of the Rubin architecture.
How does NVDA compare to the Dot-com Bubble?
The comparison is flawed. Dot-com companies often lacked revenue and profits. NVIDIA generates massive Free Cash Flow (FCF) and has a monopoly on a product that is in critical shortage globally. This is a supply/demand imbalance, not a speculative mania.
When is the best time to buy NVDA stock?
Technically, support levels around $140 have historically been strong accumulation zones. Long-term investors often use Dollar Cost Averaging (DCA) to smooth out entry prices rather than timing the exact bottom.
Disclaimer: This article is for informational purposes only and does not constitute financial advice. Please conduct your own research (DYOR) and assess your risk tolerance before trading. MEXC does not accept liability for any investment decisions made based on the information provided herein.
Join MEXC and Get up to $10,000 Bonus!
Sign Up Statement Explained")

: What It Means")
