
The importance of analyzing Bitcoin and Ethereum: two key market indicators Bitcoin (BTC) and Ethereum (ETH) are not just two cryptocurrencies; they are the primary indicators of the entire crypto market. Analyzing and examining these two currencies is crucial for any trader looking to operate in this market.
Bitcoin (BTC): the main indicator of market health Bitcoin, with the largest market value or market cap, is recognized as the primary investment in the cryptocurrency space. The price movement of Bitcoin often determines the overall market direction. When Bitcoin rises, capital usually flows toward altcoins and vice versa. Therefore, analyzing Bitcoin is like monitoring the market’s pulse.
Ethereum (ETH): the engine of innovation Ethereum, with a vast ecosystem of decentralized applications (dApps), smart contracts, and major sectors like DeFi and NFTs, is considered the engine of innovation in this industry. Ethereum’s performance indicates the level of activity and growth in the entire WEB3 ecosystem. Analyzing Ethereum helps you identify future technological and practical trends. Bitcoin BTC Analysis
CoinGlass data shows that the total liquidations in the past 24 hours have ranged between $357 million and $530 million, with over $300 million in long positions and about $70 million in short positions.
After rising to around $124,500, Bitcoin began a deep correction. The current price is fluctuating between $113,300 and $114,000, which is considered an important short-term support level.
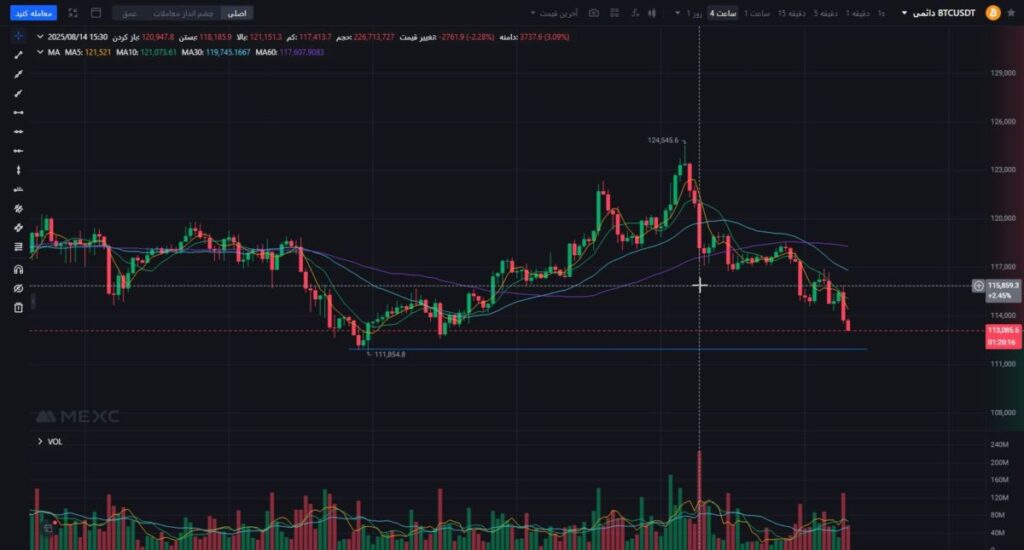
According to the chart we have used here from MEXC exchange chart , all moving averages, namely MA 5, 10, 20, 60, have a downward slope and the price is below MA 60, indicating that seller pressure is currently stronger.
Registration link for MEXC exchange
Supports: 113,000 current support 111,800 recent low – very important
110,000 psychological support
Resistances: 116.000 and MA20 118.500 – 119.000 the next strong resistance is 124.000 recent peak
Trading volume:
The increase in volume in recent bearish candles indicates the presence of strong sellers.
Buyers have not yet shown a serious reaction in this range. The RSI indicator is close to the oversold zone, which is a sign of a potential short-term recovery.
Indicator MACD is bearish and has approached the saturation area, but there is a possibility of positive divergence.
Bearish scenario for Bitcoin:
If support at 113.000 is lost and broken, a drop to 111.800 and even 110.000 is likely.
Losing $110,000 will make the market significantly bearish and could lead to further declines. Bullish scenario for Bitcoin:
If the price can stabilize above 113.000 – 114.000, there is a possibility of a rebound to 116.000 and then 118.500.
Breaking 118.500 could open the price path to re-test 124.000.
Ethereum trend analysis ETH :

After rising from 3.353 to around 4.794, the price entered a stepwise correction and formed lower peaks.
The current price close to 4.142 is located on an important horizontal support.
MAs of 60/30/10/5 are above the price. The short-term momentum is bearish, although the slope of MA60 is still bullish and indicates the maintenance of the mid-term trend.
Key levels:
Supports:
4.140 – 4.120 (momentary support and short-term pivot)
4.000 (psychological support and volume congestion area)
3.900 – 3.353 (previous support box)
3.650 – 3.353 (important structural low, losing it confirms the change of mid-term trend)
Resistances:
4.280 – 4.300 (intersection of short-term MAs and peak of minor fluctuations)
4.400 – 4.450 (supply area and around MA30)
Trading volume:
In recent bearish candles, an increase in selling volume is observed. A meaningful reversal requires a returning candle with higher buying volume. Bullish scenario for Ethereum:
Confirmation Condition: Maintain the range of 4.140 – 4.120 and close a 4-hour candle above 4.280 – 4.300 along with increased volume.
Targets: 4.400 – 4.450 – 4.600 – 4.780 – 4.800
Bearish scenario for Ethereum:
Confirmation Condition:
The loss of 4.120 -4.100 with a 4-hour close below it.
Targets: 4.000 – 3.900 – 3.860 – 3.650 and in case of selling pressure, testing 3.353
Summary:
The short-term trend of Bitcoin is downward, with support at 113.000 – 111.800 being very decisive for the future. Ethereum also entered a correction after a powerful rise to $4,794 and is now sitting on support at $4,140. As long as the price cannot regain $4,280 – $4,300 with adequate volume, the short-term momentum remains bearish.
Disclaimer:
This analysis is purely educational and does not constitute investment advice. The responsibility for decisions lies with you.
Join MEXC and Get up to $10,000 Bonus!
Sign Up


