When it comes to trading crypto, the macro story can usually be written in three lines: where stablecoins are moving, how much volume is flowing through the markets, and what the funding rates are telling you about leverage. These three signals provide traders with a real-world, near-time look into liquidity, sentiment, and where price pressure is likely to stem from.
1.Signal 1 – Stablecoin Net Flows: who is moving the digital dollars?
1.1 What it is
Stablecoin net flows measure the direction and size of transfers, which is one or more of the major stablecoins (USDT, USDC, USDP, etc.) moving on or off exchanges across wallets and across chains. Net inflows to exchanges generally mean liquidably is coming in that can buy crypto; sudden big net outflows can mean accumulation into cold storage, DeFi use, or cross-border payments;
1.2 Why is this important?
Stablecoins are the plumbing of crypto markets. When stablecoins are flowing (inwards) on exchanges to a level of billions of dollars (usually when there are established trading ranges on exchanges), markets generally have enough ‘buy-side’ for rallies or selling to clear the floors and/or increase leverage ‘firepower’ for ensuing liquidation events. When the floor trade of stablecoin supply then flows off exchanges (into custody or on-chain protocols), if in volume, it can signal accumulation or increased De-Fi activity (plugs into increasing/decreasing demand) which won’t enter the market quickly enough as sell pressure on spot exchanges.
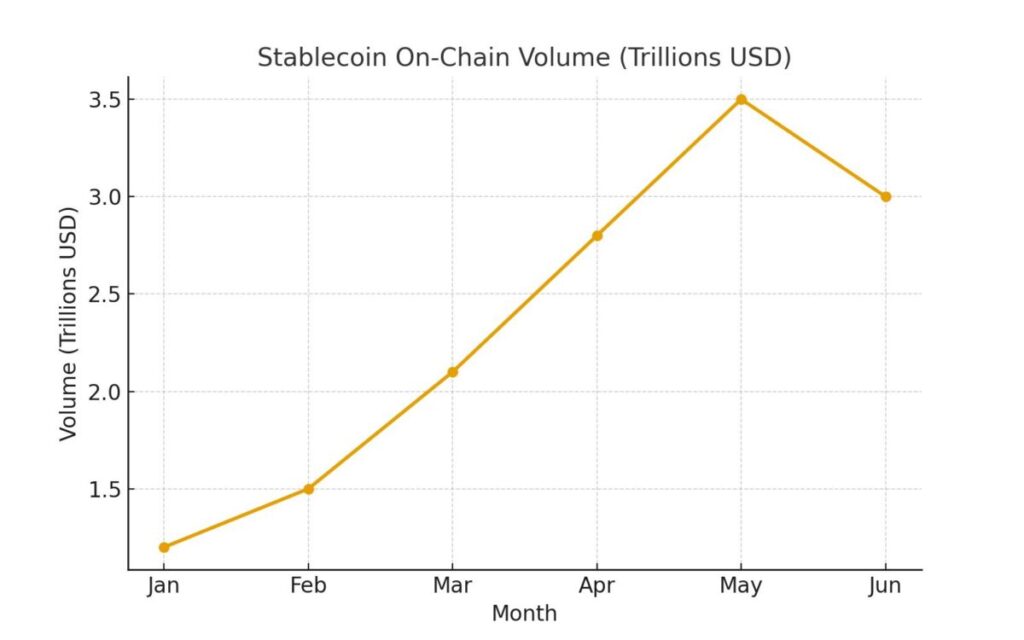
What is interesting for information-consumer readers of the data is: On-chain trackers and research desks have shown that stablecoin supply and on-chain activity have exploded in 2025-as of August with month-on-month flows running in trillions in peak month(s) – and the flows are now moving markets materially (comparison of De-Fi II); and recently and before reporting on the on-chain sector and stablecoin volumes getting close to the multi-trillion mark in August indicated the obvious trend towards larger liquidity moving into and being used beyond mere trading.
1.3 How traders read it
- Big, fast stablecoin flows (in)onto exchanges → potential near-term buying pressure (or margin fuel with derivatives).
- Persistent flows (out)from exchanges → accumulation or demand from showcasing DeFi; lower immediacy of sell pressure.
- Cross-chain spikes (e.g. flows into Base, Arbitrum or Tron) → localized liquidity where that establishes a potential buying environment that can help fuel L2 rallies or DeFi (yield picking).
1.4 Where to see it (practically)
- On-chain flow dashboards such as CoinMetrics, Chainalysis, and Artemis for chain level flows.
- Exchange inflow/outflow feeds – many analytics sites AND the exchanges own data pages publicly publish large transfer alerts. I often find MEXC’s research and news posts, which regularly pop stablecoin on-chain stats and flow events, to be a quick reference to liquidity into its spot vs derivatives for traders.
1.5 Quick trader playbook:
If there is a large inflow of stablecoins to exchanges, with rising derivatives open interest, then tighten stops and continue to monitor for a potential short-squeeze; if stablecoins are flowing off to DeFi or cold wallets, then look to accumulate (but check the funding rates – below).
2.Signal 2 – Volumes: Spot vs derivatives and where liquidity is concentrated
1.1 What is it
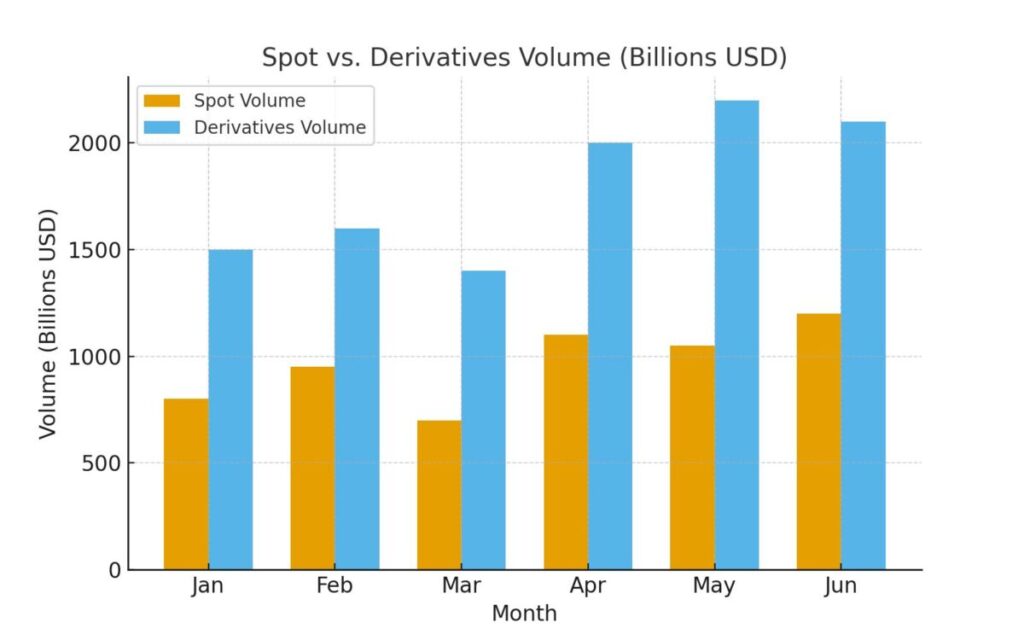
Volume is the lifeblood of markets, spot volumes indicate the demand to trade the underlying asset, while the derivatives volume (and open interest) shows how much leverage is in the mix, and where some degree of institutional or speculative capital might be.
New reports in the industry have shown different conditions by quarter; spot volumes can shift dramatically month-over-month (e.g. Q2 vs. Q1 have had meaningful drops and rebounds), and derivatives volumes (futures/perps) can often dwarf spot during highly speculative and leveraged cycles. Exchanges have reported surges in spot and derivatives volume during solid months, which helps confirm what traders know: volume spikes often precede rapid price movements.
1.2 Why it matters
- Spot volume growth and stablecoin inflows → healthy interest and demand, and likely price support.
- Derivative volume & open interest spikes and positive funding → leveraged long positioning to accelerate rallies or sharp liquidations on reversals.
- Volume concentration to a few exchanges or chains → localised liquidity risk and trade-execution slippage.
1.3 What traders look for
- Watch the derivatives-volume-to-spot-volume ratio: when derivatives outweigh specs, markets are more fragile to margin events than when they have more equilibrium.
- Watch where volume gains are taking place on geography or exchanges: mid-2025 data showed exchanges like MEXC gaining meaningful share in certain months, which can impact the market if liquidity shifts from venue/provider to a competing venue/provider.
1.4 Where to watch it (practice)
- Public exchange reports and industry reports (ex: CoinGecko, CoinMarketCap, CCData / CoinDesk Exchange Reviews) for aggregate spot and derivatives volume trends.
- MEXC’s own market pages provide pair-level liquidity and depth – always useful for execution planning. When global spot or derivative volumes peak (e.g. month-to-month bumps identified by industry reporters), adjust the trade size for slippage and liquidation risk.
1.5 Quick Trader Playbook:
When spot volumes and stablecoin on-chain flows are both up, lean towards trend-following on the spot pairs. When derivatives volume is exploding far beyond the spot volume, consider smaller size positions or hedges (inverse positions or options) because those environments are more prone to liquidation quickly.
3.Signal 3 – Funding Rates: Leverage and sentiment thermometer for market
1.1 What is it
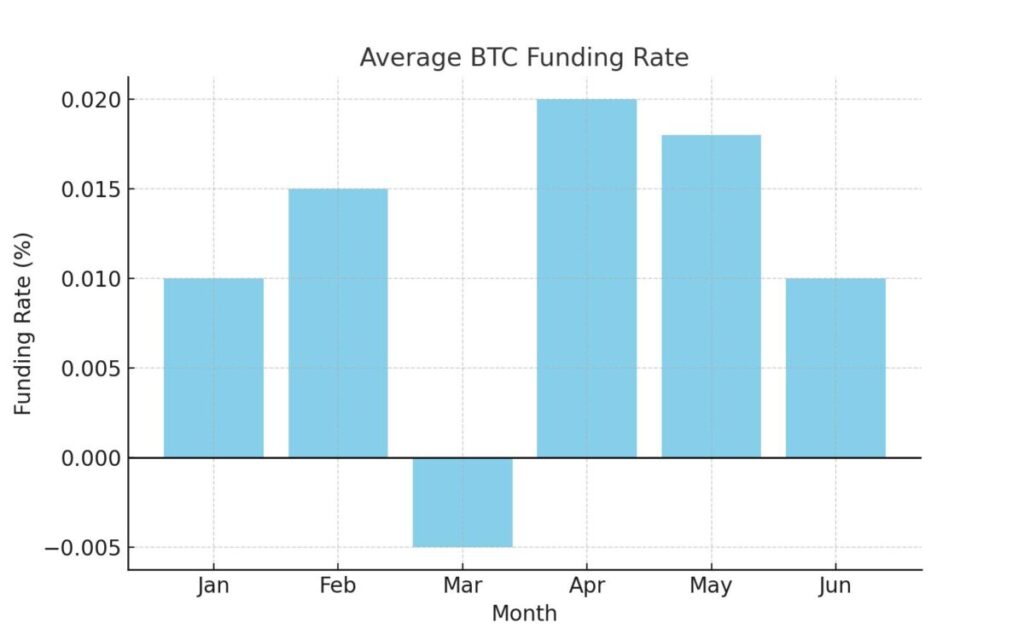
Funding rates are period payments between long and short perpetual contract holders which keep perpetual futures pricing linked to spot prices. Positive funding means longs pay shorts, and negative funding means shorts pay longs. The aggregate, open-interest weighted funding rates across exchanges acts as a real-time indicator of both leverage in the market and trader conviction.
Analysts often refer to funding rates as a “thermometer” of sentiment: a persistently high positive rate indicates exuberance in bullish leverage, whereas declining or negative funding rates might signal pending correction. During mid-2025 coverage, it was noted that the funding rates were more moderate to prior cycles… indicating a more measured leveraged stance even amidst rallies.
1.2 Why does it matter?
- Elevated, persistently positive funding → crowded longs that are susceptible to squeeze if price drops.
- Rapidly rising funding with high open interest → signals higher risk of violent moves.
- Disparities between exchanges (positive funding on one, negative funding on another) → arbitrage and basis-trade opportunities, but also venue-specific tail risks.
1.3 How traders would use it.
- Monitor funding and open interest: trying to use funding on its own is noisy; but using funding + rising OI is the warning.
- Compare funding across exchange to gauge where leverage is concentrated. Coinglass, CryptoQuant and CoinMarketCap derivatives dashboards are good comparators when trying to look at funding persistently across exchanges.
1.4 Where to view it (practical).
- Funding rate dashboards (Coinglass, CryptoQuant, exchange derivative pages).
- The MEXC futures interface shows funding and open interest for its perpetuals, so you can see the funding rate environment for the pairs you trade. Leverage this information when sizing positions and figuring out whether to hold a directional trade through funding payments.
1.5 Quick playbook for traders:
If funding is very positive, and OI is increasing, you can size your positions defensively, and expect a quick mean reversion back down. However, if funding quickly flips negatively, be cautious with short positions into squeezes, unless you have clear technical support and execution strategy.
4.Putting the three signals together (a practical example)
Think about the scenario where you see large USDT inflow onto exchanges, spot volume is increasing on the BTC and ETH pairs, and you see funding rates ticking positive (going up) and open interest is growing. Obviously in that situation you are seeing new buying power entering markets and leveraged long positions being built; perfect for momentum strategies but more of a yellow light for position sizing and risk management. Now consider the event where you are seeing stable coins flowing off exchanges back into DeFi. Spot volume is flat but funding on some perps is still positive. This might mean the liquidity conditions for leveraged long positions are very limited relying on on-chain demand to materialize. This would be an excellent long setup that could unwind very quickly.
5.Instruments and resources (where to find the data)
Useful trackers and pages:
- For on-chain stablecoin flows and volumes use; Chainalysis, CoinMetrics, Artemis, and exchange research (MEXC data posts). MEXC has conducted recent summaries of stablecoin trends and industry reports quantifying on-chain stablecoin volumes.
- For exchange and market volumes, use CoinGecko sector reports and CoinDesk/CCData Exchange Reviews of aggregate spot/derivatives metrics.
- For funding rates and open interest, use Coinglass, CryptoQuant, CoinMarketCap derivatives dashes, and every exchange futures page.
MEXC traders can combine MEXC’s pair-level liquidity pages and futures UI with these public dashes to create the full picture: where liquidity is moving, how much leverage is on the books, and whether stablecoin flows on-chain support a sustained rally.
6.Conclusion
There is no single specific metric that tells the whole story. Together, stable coin net flows, market volumes, and funding rates give you a layered view: liquidity supply, real trading demand, and all of the leverage profiled in price moves. Treat them as a composite signal set: they augment timing, sizing, and risk management when interpreted together.
When you are trading on MEXC always begin with the exchange’s market and futures pages. Then cross-reference the funding/OI and exchange flows against aggregator dashboards. Next, check on-chain stablecoin movement on analytics platforms (like TxStreet, Santiment, etc.). The whole process integrates disconnected data into a usable decision-making framework.
Disclaimer: This content is for educational and reference purposes only and does not constitute any investment advice. Digital asset investments carry high risk. Please evaluate carefully and assume full responsibility for your own decisions.
Join MEXC and Get up to $10,000 Bonus!
Sign Up?")
