
October 2025 has been one of Bitcoin’s most dramatic months in years — not just for traders watching the charts, but for analysts trying to decode what it means for the next major cycle.
With record liquidations exceeding $19 billion, Bitcoin’s price swings this month may be more than noise. Many experts believe October could mark a turning point for the market’s long-term trajectory.
1.A Decisive Battleground: $110K–$115K Range
According to Bitcoin Vector’s latest analysis, BTC has entered what they call a “decisive battleground” between $110,000 and $115,000 — a price zone that could determine whether the next big move is a breakout or breakdown.

So far, that’s exactly what has played out. Spot demand weakened sharply in mid-October amid renewed U.S.–China trade tensions, while momentum indicators have stalled. By the fourth week, BTC slipped below $110,000 — signaling growing downside risk.
2.Technical View: A Potential A–B–C Correction
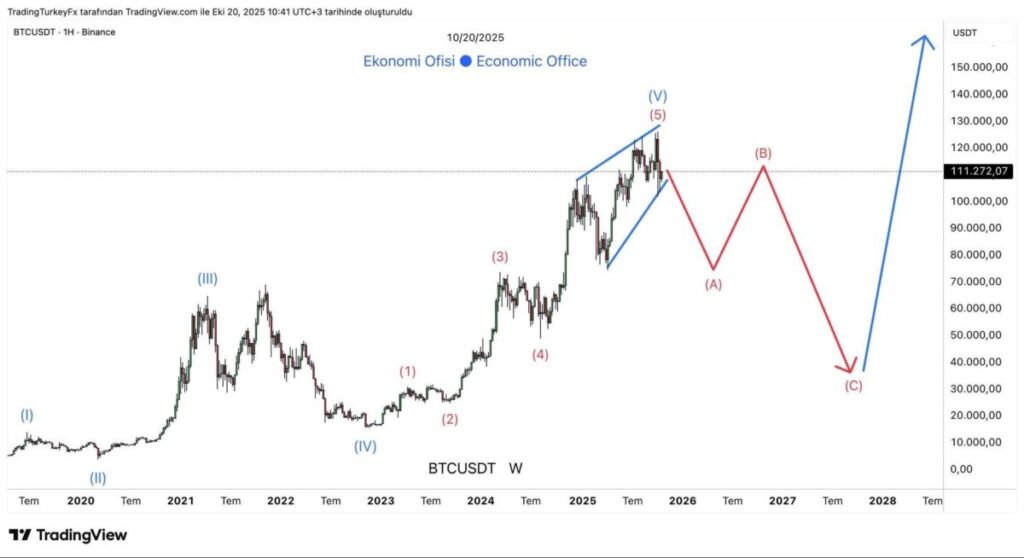
From a purely technical standpoint, analysts at Ekonomi Ofisi are mapping a potential Elliott Wave correction after Bitcoin’s multi-month rally.
Their charts suggest that BTC may have already completed its five-wave advance (1-2-3-4-5) and could now be entering a corrective A–B–C phase — a pattern that has historically preceded deeper pullbacks.
If this scenario plays out fully, Bitcoin could retrace to below $40,000 over the coming months, potentially extending a multi-year downtrend cycle before the next bull phase begins.
Elliott Wave theory implies that markets move in repetitive wave patterns — five waves up in a bull cycle, three waves down in a corrective phase.
3.The Bullish Case: Fundamentals Remain Strong
Not everyone is convinced the bears are back.
Crypto analytics firm Swissblock maintains that on-chain fundamentals remain robust, even as short-term momentum fades.
Their Bitcoin Fundamentals Index, which tracks liquidity, holder behavior, and network activity — remains at its strongest level of 2025. That suggests underlying market health remains intact.
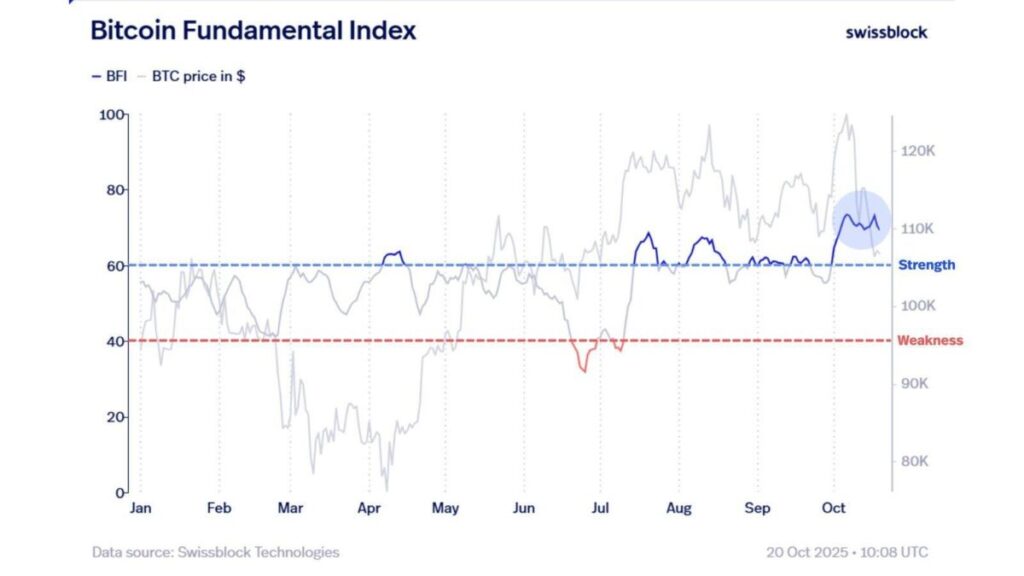
Simply put: if Bitcoin can regain and hold above $115,000 with strong buying volume, a new leg upward could quickly follow.
4.Whale and Treasury Behavior: The Balancing Act
Fresh data from 10x Research highlights two key forces shaping Bitcoin’s price action:
- Lower buying activity from corporate treasuries (e.g., MicroStrategy-type entities).
- Selling pressure from long-term “legacy” holders who accumulated during earlier cycles.
These older wallets have been selling roughly the same amount that ETFs and new investors have been able to absorb, keeping prices stable but capped. In short: BTC is consolidating. Supply and demand are balanced, but neither side has broken yet. If selling pressure from these older wallets eases and ETF demand remains steady, Bitcoin could reclaim momentum quickly.
5.Macro Crosswinds: Trade Tensions and Global Liquidity
Bitcoin’s recent stagnation isn’t happening in isolation.
- Renewed U.S.–China trade tensions have weighed on global risk sentiment.
- The stronger U.S. dollar and rising yields have also pressured risk assets.
- Liquidity conditions remain tight, making large-scale rallies harder to sustain in the short term.
These factors explain why Bitcoin has struggled to hold above $110K, despite resilient on-chain data.
6.Key Technical Levels to Watch
| Zone | Significance | Market View |
| $115,000 – $113,400 | Resistance | Breakout confirmation zone |
| $110,000 | Support turned resistance | Losing this weakens bulls |
| $100,000 | Psychological round number | Break below = major sentiment shift |
| $40,000 | Long-term correction target (if A–B–C plays out) | Deep bear cycle zone |
A decisive break above $115,000 could invalidate the bearish wave count, while a drop below $100,000 could confirm a deeper corrective phase.
7.The Big Picture: Capital Flows Decide the Next Move
Ultimately, Bitcoin’s next direction will depend on capital inflows versus outflows.
- ETF demand has stabilized but not accelerated.
- Long-term holders are realizing profits from the $30K–$100K run.
- Retail participation remains moderate compared to previous cycles.
8.MEXC Insight: What Traders Should Watch
At MEXC, where over 1,600 BTC pairs trade daily with zero maker fees, we’re observing similar positioning across derivatives markets.
Open interest remains high, but funding rates have cooled — indicating a neutral sentiment. Traders appear to be waiting for confirmation before taking directional bets.
Short-term strategy outlook:
Scalpers: Focus on range trading ($107K–$113K).
Swing traders: Watch for breakout retest above $115K.
Long-term investors: Monitor on-chain accumulation by large holders — often a reliable early-bull signal.
9.Historical Context: October’s Role in Past Cycles
Historically, October has often served as a pivot month for Bitcoin:
| Year | October Move | Following Trend |
| 2017 | +47% | Bull run to $20K |
| 2019 | +12% | Flat consolidation |
| 2022 | –17% | Bear market continuation |
| 2025 | TBD | ? |
If the pattern repeats, October’s volatility could once again mark a trend-defining transition — either confirming the start of a major correction or setting the stage for another leg up toward six-figure territory.
10.Final Takeaway
October’s turbulence might feel unsettling, but it’s often in these moments that long-term trends are born.
Whether Bitcoin confirms an extended correction or regains its bullish footing, one thing is clear: The next few weeks will likely define its multi-year trajectory.
Key takeaway: Watch $110K support and $115K resistance. A decisive break on either side will set the tone for 2026.
Trade Smarter with MEXC
Stay ahead of every cycle.
- Zero maker fees on all spot pairs
- Deep liquidity across major BTC markets
- Advanced charting tools for Elliott, Fibonacci, and wave traders
Disclaimer: This content is for educational and reference purposes only and does not constitute any investment advice. Digital asset investments carry high risk. Please evaluate carefully and assume full responsibility for your own decisions.
Join MEXC and Get up to $10,000 Bonus!
Sign Up


