
Bitcoin is trading at $88,343 as of November 24, up 1.4% in the past 24 hours and holding above the critical $88,000 level after briefly testing $80,000 over the weekend—a price not seen since April 2025. The modest recovery comes as the Crypto Fear & Greed Index remains at 10 for the third consecutive day, marking “extreme fear” at the lowest level since CoinMarketCap began tracking the metric in July 2023.
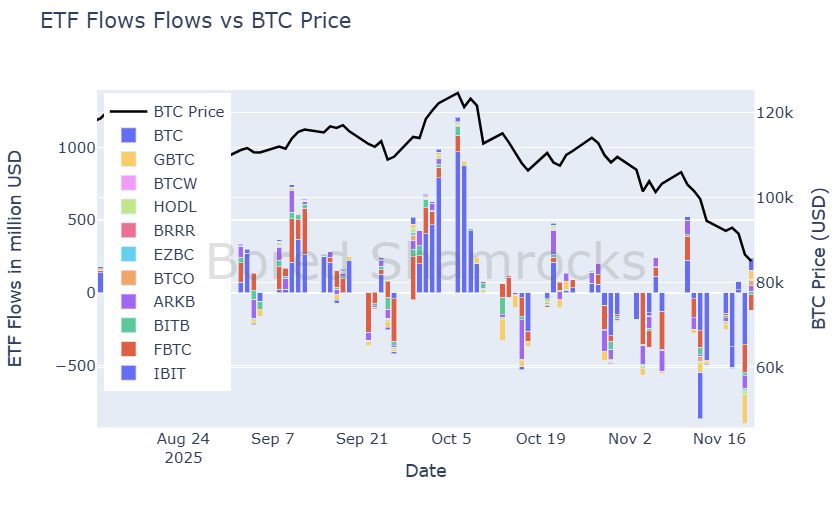
Behind the scenes, institutional activity tells a dramatic story: U.S. spot Bitcoin ETFs recorded $40.32 billion in trading volume last week, with BlackRock’s IBIT alone accounting for $27.79 billion (nearly 70%). This surge in volume, combined with sustained redemptions and price weakness, suggests institutional capitulation may be reaching exhaustion—historically a contrarian signal that bottoms are forming rather than breaking. Friday’s $238.47 million in net ETF inflows provided the first positive signal in weeks, though the market remains cautious.
Crypto Market Stabilizes Above $3 Trillion
The total cryptocurrency market cap reclaimed the crucial $3 trillion threshold on Monday morning, rising +0.5% to $3.06 trillion according to CoinMarketCap, though some sources cite $2.96 trillion—highlighting volatility in real-time measurement. Regardless of precise figures, the directional move is clear: crypto markets have bounced modestly after an intense weekend selloff.
Top Performers (24h):
- XRP: +7.45% following Grayscale and Franklin Templeton XRP ETF filings
- Dogecoin (DOGE): +5.17% on social media momentum
- Solana (SOL): +4.18% as DeFi activity rebounds
- BNB: +2.09% tracking Binance ecosystem strength
- Ethereum (ETH): +2.78% but still underperforming at $2,822—down 42.8% from August ATH of $4,946
Market Dynamics:
Bitcoin’s 1.4% gain lags behind several major altcoins, suggesting money is rotating into higher-beta assets as risk appetite tentatively returns. However, Ethereum’s persistent underperformance (lowest gain among top-10 coins) highlights lingering structural concerns around the network’s scaling roadmap and Layer-2 fragmentation.
Record ETF Volume: Capitulation or Repositioning?
The $40.32 billion in ETF trading volume last week shatters previous records, dwarfing even the euphoric inflows seen during Bitcoin’s October rally to $126,000. BlackRock’s IBIT led with $27.79 billion (69% market share), while Fidelity’s FBTC and Grayscale’s products saw elevated activity.
What This Volume Signals:
Capitulation Evidence: High trading volume during sharp price declines typically indicates forced selling by large holders who bought at higher prices. The $3.7 billion in net outflows since October 10, combined with record volume, suggests institutions are cutting losses—a “throwing in the towel” behavior that historically marks bottoming processes.
Friday’s Turning Point: The $238.47 million in net inflows on Friday (November 22) represents the first meaningful positive flow in weeks. While modest compared to peak inflows, it may signal the worst of institutional selling has passed. Ethereum ETFs also saw $55.71 million in inflows Friday, reinforcing the narrative.
BlackRock’s Perspective: Robbie Mitchnick, BlackRock’s digital assets head, stated that large asset managers’ clients are interested in Bitcoin “as a store of value, not a payments rail”—a long-term positioning that suggests strategic accumulation despite near-term volatility.
Technical Analysis: Key Levels for Bitcoin
Current Setup (Nov 24, 18:00 UTC):
- Price: $88,343
- 24h Change: +1.4%
- 24h Range: $86,073 – $89,500
- 7-day Change: -6.21%
- 24h Volume: $77 billion (elevated)
Support Levels:
- $85,000-$87,000: Current consolidation zone—critical to hold for recovery thesis
- $82,000-$84,000: Major support coinciding with April 2025 low and long-term holder cost basis
- $80,000: Weekend low—reclaim prevents retest of this psychological level
- $75,000-$78,000: Extreme support—breakdown would signal bear market confirmation
Resistance Levels:
- $90,000-$92,000: Immediate resistance—reclaim needed to shift sentiment from bearish to neutral
- $95,000: Psychological barrier—breakout would suggest bottom is in
- $100,000: Major resistance—weekly close above this invalidates bearish death cross structure
Technical Indicators:
RSI: At 22.65 on daily chart—deeply oversold territory (below 30 signals oversold). Historically, RSI below 25 precedes short-term bounces even in bear markets.
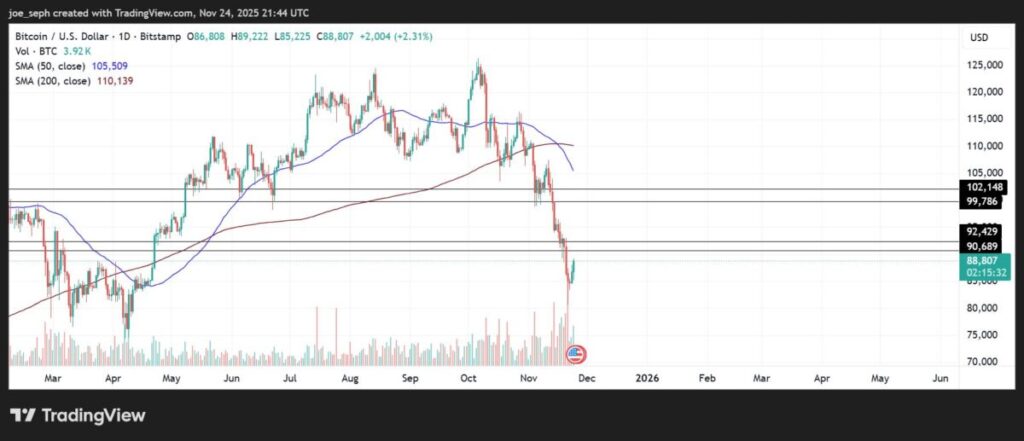
Moving Averages: Bitcoin trades below both 50-day MA ($95,446 projected) and 200-day MA ($103,322 projected), confirming the death cross pattern. Until BTC reclaims these levels, the technical structure remains bearish.
Volume: $77 billion in 24-hour trading volume (+31% from yesterday) suggests renewed interest. However, volume spike during decline (not recovery) typically indicates distribution—bearish unless reversed.
Macro Context: Fed Decision and Thanksgiving Week
Bitcoin’s recovery occurs during Thanksgiving week in the U.S., historically a low-liquidity period prone to exaggerated moves. Key macro events shaping sentiment:
This Week:
- Tuesday, Nov 26: Initial Jobless Claims + PCE inflation (Fed’s preferred metric)
- Thursday, Nov 27: U.S. markets closed (Thanksgiving)
- Friday, Nov 28: Early market close
- December 9-10: FOMC meeting with rate cut probability at ~40-67%
Fed Uncertainty:
Market-implied probability of a December rate cut has dropped from 95% three weeks ago to approximately 40-67%, creating volatility. Strong inflation or employment data this week could cement a hawkish pause, pressuring risk assets. Conversely, weak data might resurrect dovish hopes and lift Bitcoin.
Government Shutdown Impact:
The ongoing partial shutdown continues limiting economic data visibility. Fed Chair Powell’s “driving in the fog” metaphor captures policymaker uncertainty, favoring a cautious approach that may delay rate cuts—bearish for Bitcoin in the near term.
Analyst Perspectives: Is the Bottom In?
Bulls Point To:
Jason Huang (NDV): “This is a liquidity-driven correction, not a true bear market. Heavy leverage washouts, Trump tariff shock, and slowing ETF inflows triggered the 30% pullback, but fundamentals remain strong.”
Michaël van de Poppe: “Crucial areas here—if rotation occurs, Bitcoin could bounce strongly. Overall important zones for reversal potential.”
Unnamed Billionaire Investor: “Last chance to buy BTC under $90K” (reported by Cryptonews Nov 20)—sentiment that looks prescient as BTC now trades at $88K.
Bears Warn:
Technical Analysts: RSI indicator at 22.65 suggests price of BTC will decrease according to CoinCodex, with bearish sentiment (76% bearish vs. 24% bullish based on 33 technical indicators).
Motley Fool Analysis: Questions whether this is the “Great Bitcoin Crash of 2025,” though notes BTC is only down 6% year-to-date and 24% in three months—far from the 70-80% bear market crashes historically.
Neutral/Pragmatic View:
Most prudent analysts suggest the bottom may be forming but isn’t confirmed. Waiting for a daily close above $90,000 with rising volume provides higher-probability confirmation than trying to catch the exact bottom at $80,000.
Trading Strategies for Current Environment
For Active Traders:
Short-Term Scalping: With volatility remaining elevated and RSI deeply oversold, intraday swings of 3-5% remain possible. Target quick moves on breakouts above $89K or breakdowns below $86K, using tight 2-3% stop-losses.
Range Trading: Current consolidation between $86K-$90K creates opportunities for mean-reversion strategies. Sell rallies toward $89K-$90K, buy dips toward $85K-$86K until range breaks decisively.
For Swing Traders:
Wait for Confirmation: A daily close above $90,000 with volume above $80 billion would signal the low may be in. Until then, treat rallies as distribution opportunities for late bulls to exit.
Dollar-Cost Average (DCA): If accumulating for 6-12 months, scale into positions across $82K-$88K range over 2-4 weeks. Friday’s ETF inflows suggest smart money may be starting to buy—follow institutional lead with patience.
Entry Zones:
- First allocation: $86K-$88K (current range)
- Second allocation: $82K-$85K (if retest occurs)
- Third allocation: $90K+ (if breakout confirmed)
For Long-Term Holders:
Context Over Panic: Bitcoin is down 30% from ATH but up 12% year-over-year and 200%+ from 2023 lows. The network processes $50B+ daily, hash rate is at all-time highs, and institutional adoption continues via ETFs despite recent outflows.
Historical Perspective: 2017 saw six 30%+ corrections before reaching $20K. 2021 experienced multiple 50%+ crashes before hitting $69K. Current drawdown is normal bull market volatility, not bear market collapse.
Conclusion: Extreme Fear Creates Opportunity for the Prepared
Bitcoin’s stabilization at $88,343 after testing $80K, combined with Fear Index at 10 for three days and record $40B ETF volume, suggests capitulation may be nearing completion. Friday’s $238M in ETF inflows marks a potential inflection, though confirmation requires sustained buying and price reclaiming $90K+.
For traders, the message is clear: extreme fear creates asymmetric opportunities, but timing exact bottoms is impossible. The next 1-2 weeks will determine whether Bitcoin forms a base at $85K-$88K or retests $80K. Regardless, history shows buying during panic—while uncomfortable—produces superior long-term returns.
As Warren Buffett said: “Be fearful when others are greedy, and greedy when others are fearful.” With fear at 10, the question is whether you have the discipline to buy when everyone else is selling.
Disclaimer:This content is for educational and reference purposes only and does not constitute any investment advice. Digital asset investments carry high risk. Please evaluate carefully and assume full responsibility for your own decisions.
Join MEXC and Get up to $10,000 Bonus!
Sign Up


