
The crypto market is in a state of “extreme fear” as of mid-November 2025. After weeks of tense consolidation, Bitcoin has decisively breached the critical $100,000 psychological and technical support level. This move, which sent prices tumbling to multi-month lows not seen since June, was not a random fluctuation. It was a structural market breakdown driven by a confluence of panic-selling from short-term holders, large-scale institutional outflows, and a catastrophic cascade of over $650 million in leveraged liquidations.
The battle for $100,000 is over, and the bulls have lost. The entire market structure has now changed, with the old support “floor” flipping to become a new resistance “ceiling.” This article provides a professional analysis of the causes of this sell-off, the new technical levels that matter, and the market sentiment traders are now facing.
The Anatomy of a Breakdown – What Caused the $100k Breach?
The $100,000 level was more than just a number; it was a psychological fortress for the market. Its failure was not due to a single factor but a “perfect storm” of three distinct selling pressures that combined to create a cascade failure.
1. Panic Selling from “New Money”
On-chain analysis indicates the initial, primary driver of the drop was the capitulation of “short-term holders” (STH). This cohort, defined as wallets that have held Bitcoin for less than 155 days, largely bought in during the recent consolidation.
The Data: Analytics show that many of these STHs had an on-chain cost basis between $102,000 and $107,000. As the price began to waver, and especially after it fell below their entry point, this “new money” was triggered into a massive, fear-driven sell-off. On November 14 alone, these newer investors panic-sold over 148,000 BTC, the vast majority of it at a loss.
2. A Cascade of Forced Liquidations
This retail-driven panic was the “push” that toppled the first domino. As the price breached the $100,000 psychological barrier, it triggered a wave of automated, pre-set stop-loss orders and forced liquidations for over-leveraged long positions.
- The Data: In a matter of hours, over $650 million in long positions were wiped out. This is not “selling” in the traditional sense; it is a forced, mechanical event. This cascade of liquidations created a “price void,” as sell orders flooded the market with no buy-side liquidity to absorb them, pushing the price down even further and faster.
3. The Institutional “Risk-Off” Signal
While retail panic and liquidations fueled the fire, institutional players were the ones who provided the “gasoline.” This sell-off was not just a retail phenomenon; it was accompanied by “large-scale institutional outflows” and a notable reduction in ETF investments.
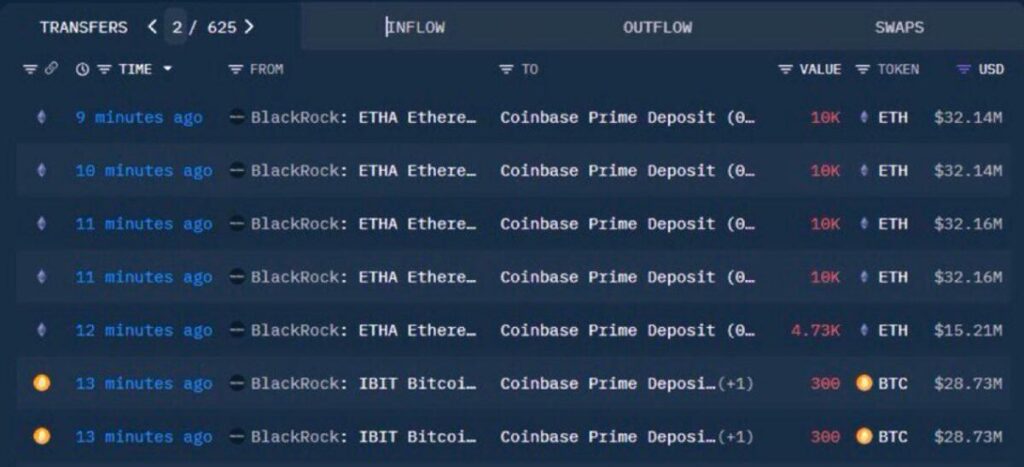
- The Data: This signals a decisive “risk-off” turn in institutional sentiment. After weeks of neutrality, major funds began to de-risk, adding to the bearish pressure. This was not panic; this was a calculated move by large-scale entities to reduce exposure, cementing the new downward trend.
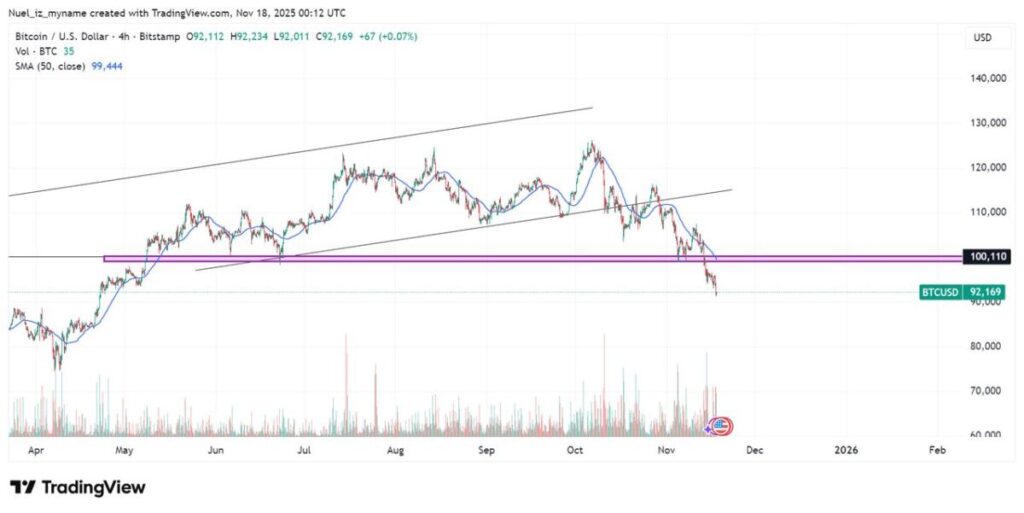
The Chart: A New Market Structure
In technical analysis, one of the most fundamental rules is that a broken support level becomes the new resistance level. The “floor” has become the “ceiling.” The battle for $100k is no longer about defending it; it’s about the market’s inability to reclaim it.
Traders must now erase their old charts and identify the new, relevant market structure.
Support Levels (The Hunt for a Bottom)
With the primary floor gone, the market is in a “price discovery” phase to the downside. The key question is: where will buyers finally step in?
- Immediate Support Zone ($94,000 – $98,000): The price is currently fighting to find a footing. The immediate zones analysts are watching are the $98,000 level (a minor psychological number) and the more significant $93,600 support band, which represents a previous low.
- Major Support Zone ($85,000 – $90,000): If the immediate support fails, all eyes will turn to the $90,000 psychological level. This area, along with the $85,000-level, represents a much stronger, longer-term consolidation zone.
- Market-Implied Support (Options Data): The options market shows a surge in bearish bets. Traders are actively buying downside protection, with heavy open interest accumulating at $90,000, $85,000, and even $80,000 strike prices. This is where the market is placing its hedges against a further fall.
Resistance Levels (The New Ceilings)
For any bullish recovery, Bitcoin must now fight its way back up through multiple layers of “trapped” sellers.
- The $100,000 Psychological Barrier: The market’s first and most difficult test. This is now the primary resistance. Any attempt to reclaim this level will be met with heavy selling pressure from two groups: 1) short-sellers placing new bets and 2) panicked investors trying to “sell the bounce” and get out at their break-even point.
- Previous Support ($106,000 – $108,000): Before the crash, Bitcoin was trading in a range between $100,000 and $108,000. This $108,000 level is now a formidable resistance zone. Any trader who bought in that range is now “underwater” and will likely use any rally back to this price to sell, creating a massive supply wall.
- Major Trend Resistance ($112,400): For the trend to be considered “decisively bullish” again, the price would need to clear all of this overhead supply and break above the $112,400 resistance zone. Until then, the short-to-medium-term trend remains firmly bearish.
Market Sentiment and the Macro-Headwinds
Unsurprisingly, the sentiment has flipped from “Neutral” to “Extreme Fear.” This reflects the widespread panic and highlights a market that is deeply unsettled and now skewed to the downside.
This technical and sentimental weakness is currently overpowering the more mixed macroeconomic environment.
- The Bullish Undercurrent (Long-Term): The Federal Reserve has signaled a potential policy pivot toward easing liquidity. In the medium-to-long term, this is a powerful, bullish tailwind for a scarce asset like Bitcoin.
- The Bearish Reality (Short-Term): The macro-environment is complex. While the end of the U.S. government shutdown provided a brief moment of stabilization, it was not enough to counteract the technical weakness and persistent global economic challenges.
For now, the technical damage and negative sentiment are in full control of the market. The key question for all investors is whether this is a deep, violent, but necessary correction within a larger bull market, or the start of a more sustained bearish trend.
The battle for $100,000 has been lost by the bulls. The market is now in the difficult process of discovering a new, lower price range where buyers are finally willing to step in and build a new foundation.
Disclaimer: This content is for educational and reference purposes only and does not constitute investment advice. Digital asset investments carry high risk. Please evaluate carefully and assume full responsibility for your own decisions.
Join MEXC and Get up to $10,000 Bonus!
Sign Up – Session with Daniel Haudenschild")


