Key Takeaway: The Price-to-Earnings (P/E) ratio measures how much investors pay for each dollar of earnings. It helps traders identify undervalued gems for Spot holding or overvalued stocks suitable for Short selling in Futures markets.
If you are diving into the financial markets, the P/E ratio is your compass. It cuts through the noise, revealing whether a stock like Tesla or Apple is a bargain or a bubble.
In this guide, we will break down the mechanics of the P/E ratio and how savvy traders use it to make decisions on platforms like MEXC, where both Spot xStocks and Stock Futures are available.
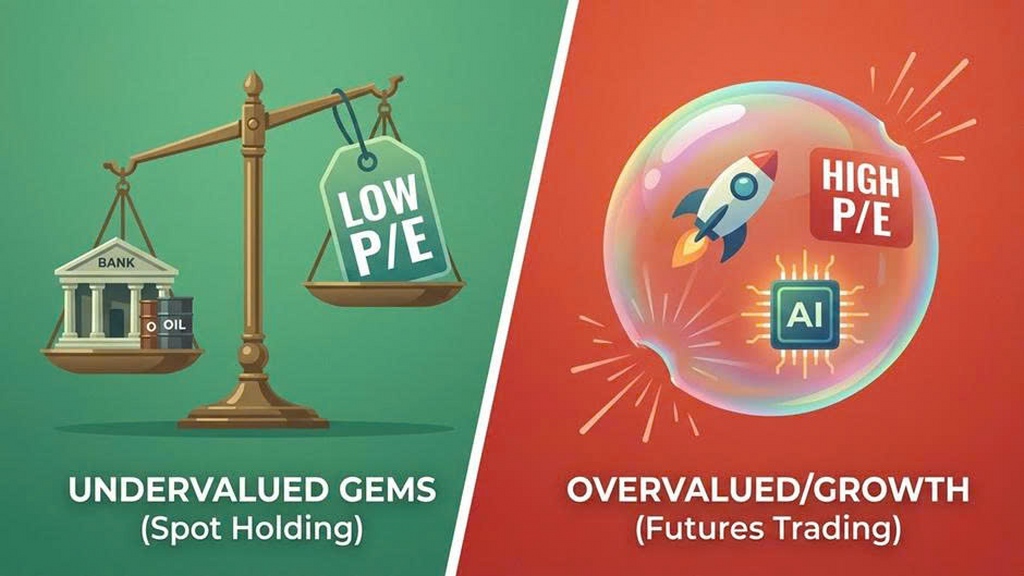
Table of Contents
1. What Is the Price-to-Earnings (P/E) Ratio?
The P/E ratio is the “price tag” of a company’s profitability. A P/E of 20 means you pay $20 for every $1 the company earns.
Think of the P/E ratio as a standardized metric to value assets:
- High P/E: The market expects high growth (Growth Stocks). Often associated with volatility, a playground for Futures traders.
- Low P/E: The stock might be undervalued (Value Stocks). Ideal for long-term Spot portfolios.
Pro Tip: Never analyze P/E in a vacuum. Compare it against the industry average to decide whether to “Go Long” (Buy) or “Go Short” (Sell).
2. P/E Ratio Formula and Calculation
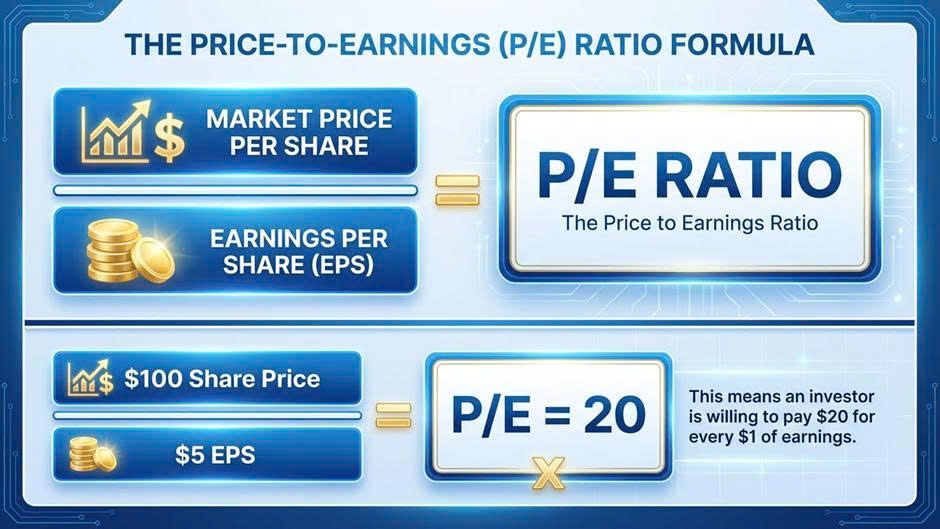
Formula Snapshot:
P/E Ratio = Market price per Share / Earnings per Share (EPS)
Calculating the P/E ratio is straightforward.
- Example: If TechCo trades at $100 and has an EPS of $5, the P/E is 20.
This simple number tells you if an asset currently trading on the market is overpriced relative to its real earnings power.
3. Types of P/E Ratios: The Battle of Past vs. Future
In the fast-moving world of stock trading, reliance on the wrong data can lead to costly mistakes. Understanding the nuance between Trailing and Forward P/E is what separates amateur investors from professional traders.
Trailing P/E (The Reality Check)
- What it is: This metric uses the Earnings Per Share (EPS) from the last four quarters. It is the “hard truth” because the money has already been made.
- When to use it: Use Trailing P/E when evaluating stable, mature companies (like utility stocks or established banks) for your Spot xStocks portfolio on MEXC. You want assurance, not speculation.
- The Trap: It is a rearview mirror. If a company’s stock price crashes today because of bad news, the Trailing P/E might still look “cheap” because the past earnings were good. Don’t catch a falling knife based on old data.
Forward P/E (The Speculator’s Tool)
- What it is: This uses projected earnings for the next four quarters. It reflects the market’s optimism (or pessimism).
- When to use it: This is the Holy Grail for Stock Futures traders. Markets move based on expectations, not just history. If a company like NVIDIA or Tesla has a Forward P/E significantly lower than its current P/E, analysts are predicting massive profit growth.
- The Trap: Analysts can be wrong. If a company misses these high earnings estimates, the stock price often collapses instantly.
- Strategy Hint: If you see a high Forward P/E and suspect analysts are too optimistic, this could be a setup for a Short position on MEXC Futures.
4. How to Interpret P/E: Spotting Bargains vs. Bubbles
A common rookie mistake is thinking “Low P/E is always good” and “High P/E is always bad.” The reality of the stock market is far more complex.
The “Value Trap” (Low P/E Warning)
Imagine seeing a stock with a P/E of 5 while the industry average is 20. Is it a bargain? Maybe. But it could also be a Value Trap.
- Scenario: The stock price might have plummeted because the company is losing market share, facing lawsuits, or becoming obsolete (think outdated tech).
- Action: Before buying on Spot, check the revenue trend. If earnings are shrinking, a low P/E is not a discount, it’s a warning sign.
The “Growth Premium” (High P/E Justification)
Stocks like Amazon operated with P/E ratios over 100 for years. Why? Because investors were paying for exponential growth.
- Scenario: A P/E of 50+ usually means the market expects the company to double or triple its size.
- Action: For high P/E stocks, volatility is guaranteed. This environment is perfect for Futures Trading strategies where you can capitalize on the sharp price swings that occur during earnings reports.
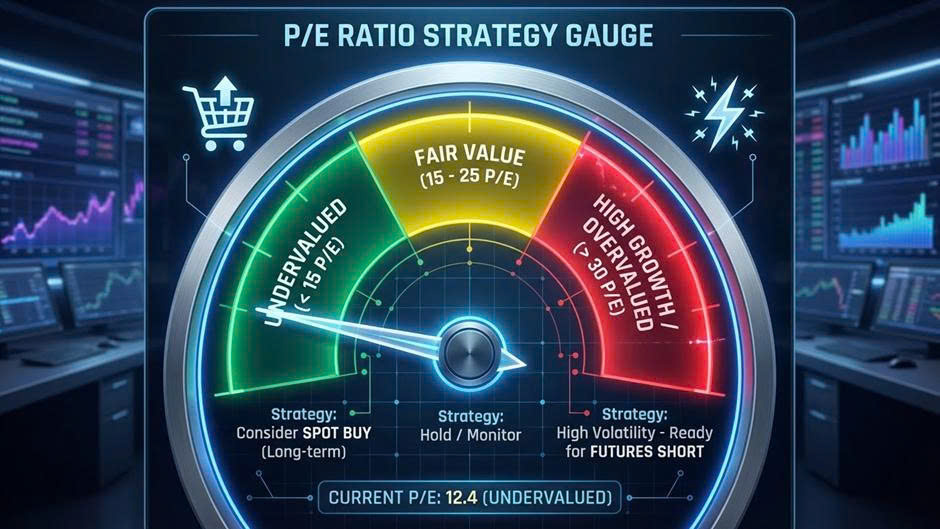
Rule of Thumb for Traders:
- P/E < 15: Often undervalued or slow-growth. Good for defensive Spot holding.
- P/E 15 – 25: Market average (Fair Value).
- P/E > 30: High growth or overvalued. High volatility expected (Prime territory for Futures).
Industry Comparison Table (Jan 2026 Data)
| Industry | Average P/E Ratio | Example Stock & P/E | Analysis |
| Technology | 38.42 | Apple (AAPL): 35.00 | Priced for innovation and ecosystem dominance. |
| Banking | 12-15 | JPMorgan (JPM): 15.37 | Priced for stability and dividends. |
| S&P 500 | 27.64 | Market Average | The benchmark for the broader economy. |
5. Limitations of the P/E Ratio
Warning: P/E ignores debt and growth rates. For a more complete analysis, combine P/E with the PEG Ratio (Price/Earnings-to-Growth).
While powerful, the P/E ratio has blind spots:
- Debt: It does not account for a company’s debt load. A company might have a low P/E simply because high debt makes it risky.
- Growth Rate: It doesn’t tell you how fast earnings are growing. This is why the PEG ratio is often preferred for tech stocks.
- One-Time Charges: Non-recurring expenses can skew EPS, making the P/E ratio misleadingly high or low.
Conclusion: Turn Analysis into Action
The P/E ratio is more than just a number, it’s a decision-making tool.
- Is the P/E too high? The market might be overextended, consider hedging with Stock Futures.
- Is the P/E low vs peers? It might be a buying opportunity on Spot.
You don’t need a Wall Street account to act on these insights. With MEXC, you can access tokenized stocks and futures, allowing you to trade top global companies seamlessly alongside your crypto portfolio.
Ready to test your strategy? Explore real-time charts and trade Stock Futures on MEXC today.
Frequently Asked Questions (FAQs)
- What is considered a “good” P/E ratio?
There is no single number. Historically, the S&P 500 average is around 20-25. For value stocks, a P/E of 15-20 is considered solid. For high-growth tech stocks, a P/E of 30+ is normal. Always compare the ratio to the specific industry average.
- Can a stock have a negative P/E ratio?
Yes. If a company is losing money (negative earnings), it has no P/E ratio (or a negative one). This is common in early-stage startups or companies in turnaround mode.
- Why is Tesla’s P/E ratio so much higher than Apple’s?
Tesla (P/E ~298) is valued as a high-growth disruptor in EV and AI technology, implying investors expect massive future profit expansion. Apple (P/E ~35) is viewed as a mature, highly profitable tech giant, commanding a premium but stable valuation.
- How does the P/E ratio differ from the PEG ratio?
The P/E ratio only looks at current price and earnings. The PEG ratio adds a third variable: Growth Rate. It calculates P/E divided by the expected earnings growth rate, giving a fairer valuation for fast-growing companies.
Join MEXC and Get up to $10,000 Bonus!
Sign Up


