Key Takeaways
- Financial Snapshot: A balance sheet provides an instant view of a company’s financial health (Assets, Liabilities, and Equity) at a specific date.
- The Golden Rule: It strictly follows the accounting equation: Assets = Liabilities + Shareholders’ Equity.
- Liquidity vs. Solvency: It is the primary tool for investors to assess short-term liquidity (Current Ratio) and long-term leverage (Debt-to-Equity).
- Real-World Context: Fresh FY2025 data from Apple ($331.23B total assets end-FY2025) and Tesla (~$133.74B Q3 2025) shows powerhouse structures.
Understanding a company’s financial position is the first step toward intelligent investing and effective management. The balance sheet provides a comprehensive snapshot of what a company owns, what it owes, and the value remaining for shareholders at a specific point in time.
Table of Contents
What Is a Balance Sheet?
A balance sheet is a financial snapshot showing a company’s assets, liabilities, and equity at a specific date, helping you assess stability and liquidity instantly.
Unlike the income statement, which covers a period of time, the balance sheet acts as a freeze-frame of financial health. That’s exactly what it does for businesses, like Apple’s FY2025 Q4 (Sep 27, 2025) with $331.23 billion total assets, down strategically from $364.98B prior. Think of a personal net worth app, scaled up, you spot cash flow ease instantly.
Analyst Note: Think of the balance sheet as a “Net Worth” report for a business. It reveals if cash flows smoothly or if growth is funded smartly.
Key Components of a Balance Sheet
A balance sheet is divided into three core sections based on the accounting equation. Understanding the nuances of each section allows traders to distinguish between a company that is merely surviving and one that is primed for explosive growth.
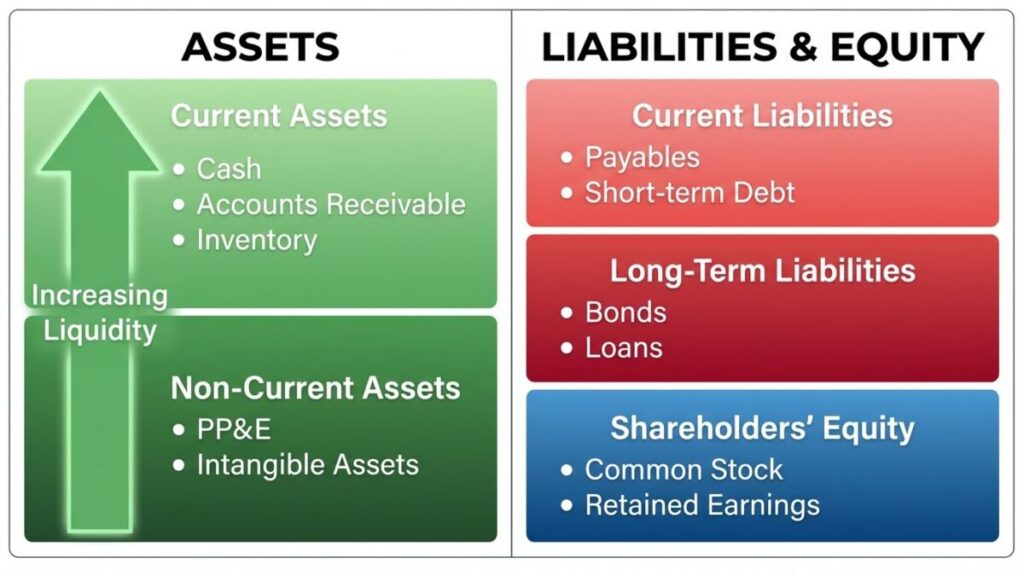
1. Assets – What a Company Owns
Assets represent the resources controlled by a company that are expected to generate future economic value. On the balance sheet, these are listed in order of liquidity, how easily they can be converted into cash.
- Current Assets (Short-Term): These are the lifeblood of daily operations, expected to be sold or used within one year.
- Cash & Equivalents: The most liquid asset (e.g., bank deposits, treasury bills).
- Accounts Receivable: Money owed to the company by customers for goods/services delivered.
- Inventory: Raw materials or finished goods ready for sale.
- Real-world Data: Apple’s Q4 FY2025 current assets: $118.67 billion (cash $28.16B), buffering ops perfectly.
- Non-Current Assets (Long-Term): These are illiquid investments intended to generate revenue over many years.
- Property, Plant, & Equipment (PP&E): Physical structures like factories, warehouses, and machinery.
- Intangible Assets: Non-physical items such as patents, trademarks, and brand reputation.
- Real-world Data: Tesla Q3 2025 total assets ~$133.74 billion, with PP&E fueling Gigafactories.
Investor Insight: High Current Assets usually signal safety, while growing Non-Current Assets signal expansion. When trading futures, look for a balance. Too much cash might mean the company isn’t innovating; too little might mean liquidity risk.
2. Liabilities – What a Company Owes
Liabilities are the financial obligations the company owes to outside parties. They are the “claims” against the company’s assets.
- Current Liabilities (Due < 1 Year): Obligations that must be settled soon. High current liabilities aren’t always bad, they can indicate strong negotiating power with suppliers.
- Accounts Payable: Money owed to suppliers for inventory or raw materials.
- Short-term Debt: Loans or credit lines due within 12 months.
- Real-world Data: Apple’s Q4 FY2025: $144.57 billion (payables $54.13B), strategic delays boost cash use.
- Long-Term Liabilities (Due > 1 Year): Debts used to finance major expansions or acquisitions.
- Bonds Payable: Corporate bonds issued to investors.
- Long-term Lease Obligations: Contracts for rented properties or equipment.
- Real-world Data: Tesla Q2 2025 current liabilities ~$28.82B (prior trend), total liabilities $50.50B, lean leverage.
3. Shareholders’ Equity – Owners’ Claim
Equity, often called “Book Value,” represents what would be left for shareholders if all assets were sold and all debts paid off. It tells you how much “skin in the game” the owners have.
- Common Stock: The initial capital invested by shareholders to start or expand the company.
- Retained Earnings: The portion of net income that is reinvested back into the business rather than paid out as dividends. This is the primary engine for organic growth.
- Treasury Stock: Shares the company has bought back from the open market (reducing equity but often boosting EPS).
- Real-world Data & Strategy: Apple’s FY2025 equity trends strong via buybacks; Tesla Q2 2025 equity $77.31B (retained $36.79B).
The Fundamental Accounting Equation
The balance sheet adheres to a strict formula known as the Accounting Equation:
Assets = Liabilities + Shareholders’ Equity

This equation must always balance, everything a company owns (assets) is funded by borrowing (liabilities) or owners’ capital (equity). For example, Apple’s Q4 FY2025: $331.23B = Current $144.57B + Non-Current + Equity (balanced perfectly). Tesla scales similarly, transactions keep it true.
- Why it matters: Every transaction touches both sides, ensuring accuracy, like buying equipment with a loan boosts assets and liabilities by the same amount.
- Strategic Context: Understanding these 2025 baselines is vital for forecasting. Analysts predict that companies mirroring these healthy asset-to-liability ratios will likely dominate the sector throughout 2026.
Grab a company’s latest filing today, and you’ll see this equation light up opportunities everywhere!
How to Analyze a Balance Sheet: Financial Ratios
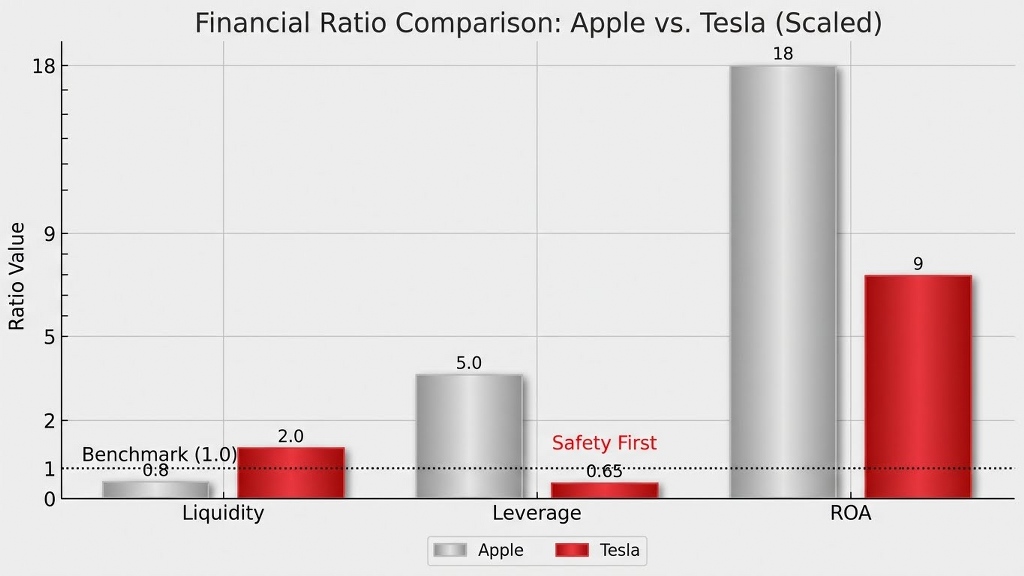
To evaluate financial health, analysts compare specific numbers from the balance sheet. Below are the key ratios used to assess Apple and Tesla based on 2025 data.
| Ratio | Formula | Apple FY2025 Q4 | Tesla Q3 2025 Est. | Benchmark |
| Current Ratio | Current Assets / Current Liabilities | $118.67B / $144.57B = 0.82 | ~2.0+ (trend) | >1 ideal; Apple’s cash speed covers. |
| Debt-to-Equity | Total Liabilities / Equity | ~5.0+ (leveraged buybacks) | ~0.65 | Lower safer; Tesla growth-light. |
| ROA | (Net Income / Assets) × 100 | ~15-20% ($112B NI / ~$350B avg) | ~8-12% | Efficiency winner. |
Apple’s FY2025 revenue hit $416B!
Strategic Implications & Common Pitfalls
Why the Balance Sheet Matters
Robust 2025 sheets doubled FDI for tech leaders.
Common Mistakes in Interpretation
- Ignoring Valuation Methods: Assets are often recorded at historical cost, not current market value.
- Overlooking Off-Balance Sheet Items: Leases or contingent liabilities may not appear clearly but still pose risks. Always read the footnotes in SEC filings (like the 10-K).
Conclusion
Master sheets with 2025 updates, from Apple’s $331B fortress to Tesla’s $133B agility. Ratios reveal potential!
By mastering ratios like the Current Ratio and Debt-to-Equity, investors can peel back the layers of a company’s operations to reveal its true risks and potential.
From Analysis to Action: Trade Stock on MEXC
Now that you understand how to analyze a balance sheet, you can apply these insights to capitalize on market movements. Whether you spot a strong undervalued company or an overleveraged one, MEXC allows you to trade top global stocks alongside cryptocurrencies.
Why switch between apps? Access the world’s biggest companies directly on MEXC:
- MEXC Stock Futures: Trade top-tier assets like Apple (AAPL), Tesla (TSLA), and NVIDIA (NVDA) with leverage up to 50x. Perfect for hedging or maximizing positions based on your financial analysis.
- Spot xStocks: Prefer holding the asset? Buy and sell fractional shares seamlessly with USDT.
- Zero Boundaries: Enjoy high liquidity and fast execution speeds normally reserved for crypto markets.
Start Trading Stock Futures on MEXC Today. New to this? Read our guide on How to Trade Stock Futures on MEXC
Frequently Asked Questions (FAQ)
- What is the primary purpose of a balance sheet?
It provides an objective “snapshot” of a company’s financial health at a single moment in time, detailing asset liquidity, debt obligations, and shareholder value.
- How often is a balance sheet published?
Public companies are required to file balance sheets quarterly (10-Q) and annually (10-K).
- Why does the balance sheet always balance?
This is due to the double-entry bookkeeping system. Every transaction has two sides, ensuring the equation $A = L + E$ always holds true.
- Can I use a balance sheet for personal finance?
Yes. A personal balance sheet lists your assets versus your liabilities to calculate your Personal Net Worth.
Join MEXC and Get up to $10,000 Bonus!
Sign Up Explained")
: Auto Manufacturer or Tech Giant?")

