Ethereum (ETH), the second-largest cryptocurrency by market capitalization, is displaying increased volatility compared to Bitcoin (BTC), according to recent market data. This development comes as the crypto market experiences a complex interplay of factors affecting asset performance and investor sentiment.
Volatility Metrics and Market Dynamics
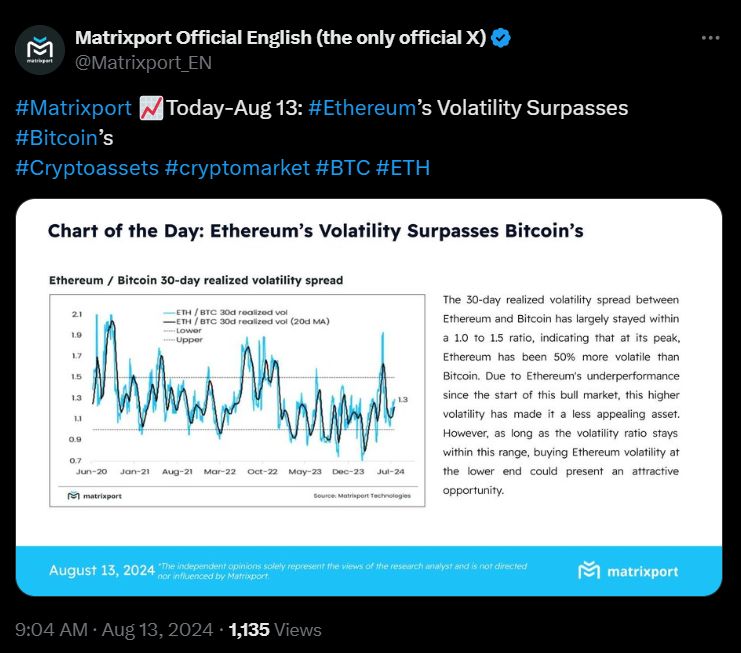
Matrixport’s latest report reveals that Ethereum’s 30-day realized volatility spread relative to Bitcoin has expanded to a range of 1.0 to 1.5. This indicates that ETH’s price fluctuations are now up to 50% more pronounced than those of BTC.

Historically, this volatility ratio has been a key metric for traders and analysts to gauge relative market risk and potential trading opportunities between the two leading cryptocurrencies.
The heightened volatility coincides with a period of underperformance for Ethereum since the onset of the current bull market cycle. Despite this, ETH has shown a 7.9% increase over the past week, marginally outpacing BTC’s 7.5% gain.
Ethereum ETF Market Dynamics
The launch of spot Ethereum ETFs has introduced a new dimension to the market. Despite ETHE’s substantial outflows, the overall U.S.-based spot Ether ETF market showed positive movement on August 13, with total net inflows of $24.3 million. This indicates a diversification of investor interest across different Ethereum investment vehicles.

Interestingly, ETH marked its first day without any outflows on August 12, breaking a streak of consecutive daily withdrawals since its inception. This event coincided with spot Ether ETFs experiencing positive flows for the fifth time since their launch on July 23.
The performance of these ETFs is providing new insights into institutional and retail investor sentiment towards Ethereum. BlackRock’s iShares ETF (ETHA) and Fidelity’s ETF (FETH) have shown particularly strong performance, with significant inflows contributing to their growing assets under management.
On-Chain Activity and Technical Analysis
While Ethereum’s price volatility has increased, the network has experienced a notable uptick in on-chain activity across its main chain and layer-2 networks. This surge in network usage could potentially influence ETH’s value proposition and future price action.
The increased network activity coincides with significant developments in the Ethereum ecosystem, particularly in the realm of decentralized finance (DeFi) and Ethereum-based investment products. These factors are likely contributing to the heightened interest and volatility in the Ethereum market.
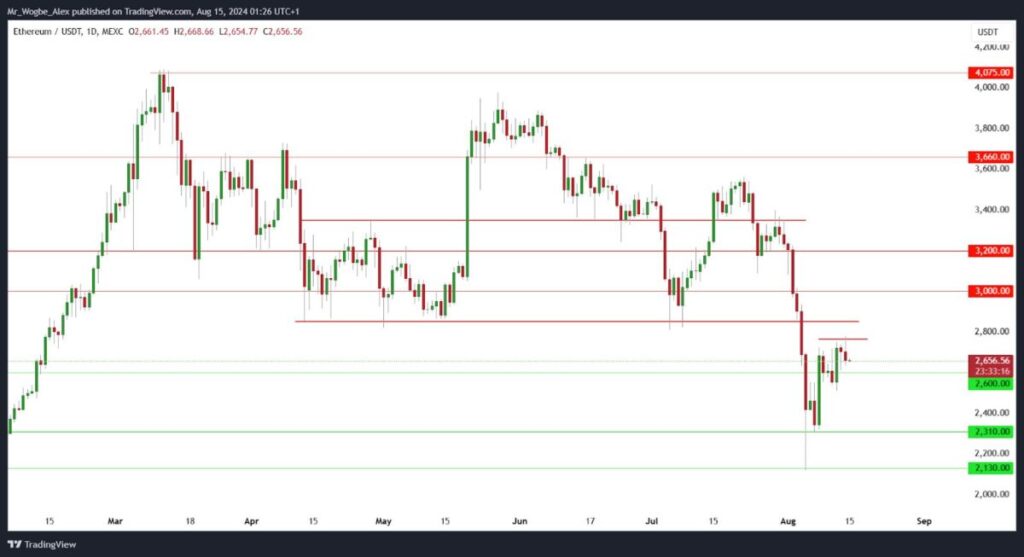
From a technical perspective, Ethereum is struggling to maintain upward momentum as gains remain capped around the $2,765 mark. This leaves the cryptocurrency in a back-and-forth pattern between the $2,765 and $2,600 support.

That said, the next dip to this level could be followed by a strong rebound to the $3,000 range due to the bullish accumulation around that zone. From our perspective, a renewed bearish push lower is not likely at the moment.
ETH Statistics Data
ETH Current Price: $2,655
Market Cap: $320.6B
ETH Circulating Supply: 120.2M
Total Supply: 120.2M
ETH Market Ranking: #2
Get accurate, winning trading signals: https://learn2.trade/
Best crypto trading bot: https://learn2.trade/crypto-trading-bot
Personal Note From MEXC Team
Check out our MEXC trading page and find out what we have to offer! There are also a ton of interesting articles to get you up to speed with the crypto world. Lastly, join our MEXC Creators project and share your opinion about everything crypto! Happy trading! Learn about interoperability now!
Join MEXC and Get up to $10,000 Bonus!
Sign Up


