Trading in cryptocurrency markets is a combination of science, art, and psychology. Successful traders rely on technical analysis tools to predict price movements and find optimal entry and exit points. Among the plethora of chart patterns, “Double Top” and “Double Bottom” hold a special place — classic reversal figures that help identify trend changes. These patterns are particularly relevant to the cryptocurrency market, where high volatility creates numerous opportunities for their formation.
In this article, we will take a detailed look at what a “double top” is, how it works, how it differs from a “double bottom,” and how to apply these patterns for trading on the MEXC crypto exchange. You will find step-by-step instructions, real examples, advanced strategies, and tips that will help you master these tools and increase the efficiency of your trades. Whether you are a beginner or an experienced trader, this article will be your guide to the world of reversal patterns.
What is the “Double Top” pattern?
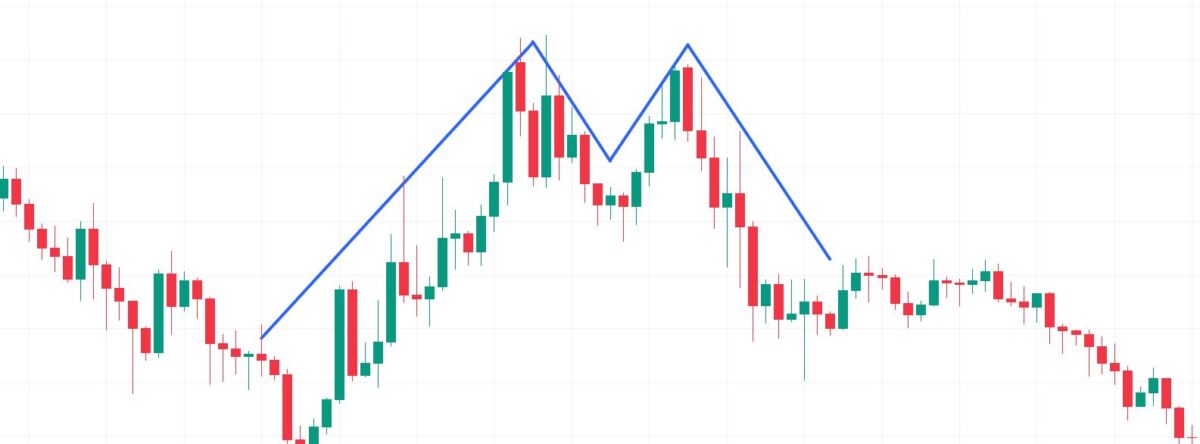
The “Double Top” is a bearish technical analysis pattern that signals the reversal of an uptrend into a downtrend. On a chart, it looks like the letter “M” and consists of two peaks (tops) at the same resistance level, separated by a correction, and is completed by a breakout of the support level known as the “neckline.” This pattern is often found in cryptocurrency markets such as Bitcoin (BTC), Ethereum (ETH), or altcoins traded on MEXC due to their dynamic nature.

How is a “Double Top” Formed?
The formation of the pattern occurs in several stages:
- Uptrend: Before the appearance of a “double top,” the price of the asset shows a steady rise. This can be caused by bullish news, increased demand, or speculative frenzy. For example, Bitcoin might rise following the announcement of institutional investments.
- First Peak: The price reaches a local high — the resistance level, where buyers face strong opposition from sellers. A downward correction begins after the peak, forming the first “hump” of the letter “M”.
- Neckline: The correction brings the price to a support level (neckline), which often coincides with previous lows or significant levels (e.g., 50% Fibonacci).
- Second Peak: The price rises again to the resistance level, forming a second peak. However, the bulls fail to break this barrier, and trading volume usually decreases, indicating a weakening buying momentum.
- Neckline Breakout: After the second peak, the price falls below the neckline, confirming the pattern’s completion. This breakout is often accompanied by an increase in volume, reinforcing the bearish signal.
Psychology of “Double Tops”
The “Double Top” reflects a shift in market sentiment. The first peak shows that the bulls have reached the height of their capabilities, with a downward correction being the first sign of weakening demand. The second peak confirms that the resistance level is too strong, and the buyers are losing control. A breakout of the neckline signals the capitulation of the bulls and the beginning of bear dominance.
Example of a “Double Top” on MEXC
Imagine you are analyzing the BTC/USDT pair on the daily MEXC chart. Bitcoin’s price rises from $50,000 to $65,000 over two weeks, forming an upward trend. It then peaks at $65,000, retraces to $60,000 (neckline), rises again to $65,000 but fails to break that level. After the second peak, the price falls below $60,000 with increasing selling volume. This is a classic “double top,” indicating the start of a downward movement.
What is the “Double Bottom” pattern?
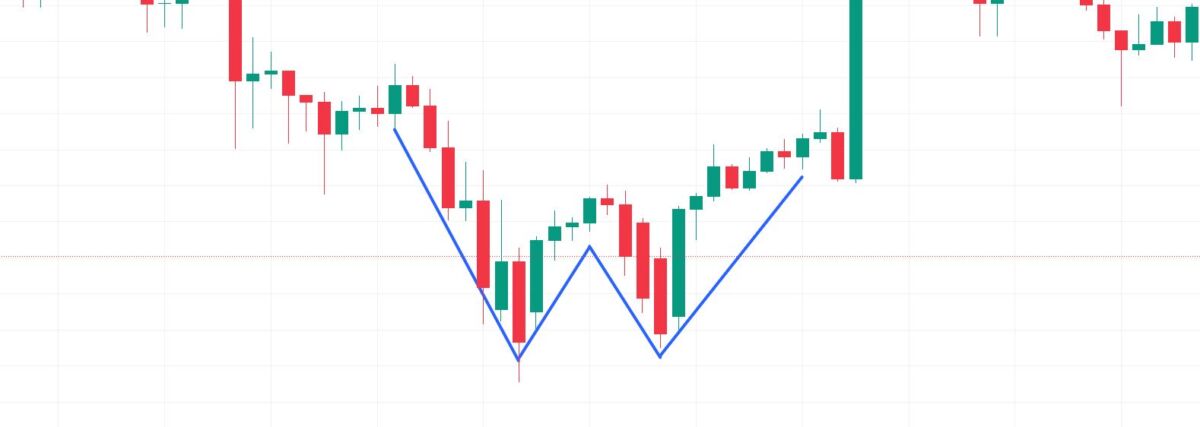
“Double bottom” is a bullish reversal pattern, opposite to the “double top.” It forms at the end of a downtrend and signals an impending price increase. On a chart, it resembles the letter “W,” where the price tests the support level twice but does not break it downward, after which an upward movement begins.

How does a “Double bottom” form?
The formation process includes the following stages:
- Downtrend: Before the pattern appears, the asset’s price decreases, reflecting bearish sentiment. For example, Ethereum may fall after market sell-offs.
- First bottom: The price reaches a local minimum — a support level, where selling pressure weakens, and buyers begin to intervene. This is followed by a rebound upward.
- Neckline: The price rises to the resistance level (neckline), which often coincides with previous highs.
- Second Bottom: The price falls again to the support level, forming a second bottom. The bears are unable to continue the decline, and buyers take the upper hand.
- Neckline Break: The price breaks the neckline upwards, confirming a trend reversal. The breakout is usually accompanied by an increase in volume.
Psychology of the “Double Bottom”
The “Double Bottom” shows that the support level is strong enough to withstand seller pressure. The first bottom indicates a weakening of the bearish momentum, and the second bottom confirms that sellers have exhausted their strength. The upward break of the neckline signals a bulls’ victory and the start of an uptrend.
Example of a “Double Bottom” on MEXC
Suppose you are trading the ETH/USDT pair on the 4-hour MEXC chart. The price of Ethereum drops from $2,500 to $2,000, forming the first bottom. After bouncing to $2,200 (neckline), it falls again to $2,000, creating the second bottom. Then the price breaks above $2,200 with an increase in volume. This is a “double bottom,” indicating the start of a bullish trend.
Differences Between “Double Top” and “Double Bottom”
| Characteristic | Double Top | Double Bottom |
| Pattern Type | Bearish (downward reversal) | Bullish (upward reversal) |
| Shape on the Chart | “M” | “W” |
| Preceding Trend | Ascending | Descending |
| Key Level | Resistance | Support |
| Signal | Breakdown of the neckline downward | Breakout of the neckline upward |
| Volume | Declines at the second peak | Rises at the second bottom |
These patterns are mirror images of each other, but they are united by the goal: to help traders identify trend reversal points.
How to Use “Double Top” and “Double Bottom” on MEXC?
MEXC crypto exchange provides traders with powerful tools for analysis and trading, including intuitive TradingView charts, a wide selection of trading pairs, and low fees. Here is a step-by-step guide on applying these patterns:
Step 1: Trend Identification
Before looking for patterns, determine the current trend:
- Use time frames (1H, 4H, 1D) on MEXC charts.
- Apply moving averages (MA 50, MA 200) or the ADX indicator to confirm the direction.
Step 2: Pattern Identification
- “Double Top”: Look for two peaks at the same resistance level after an uptrend. A decrease in volume at the second peak is an important sign.
- “Double Bottom”: Find two lows at the same support level after a downtrend. An increase in volume at the second bottom strengthens the signal.
Step 3: Breakout Confirmation
Do not enter a trade until confirmation:
- For a “Double Top”, wait for a candle close below the neckline.
- For a “Double Bottom” — a candle close above the neckline.
Step 4: Setting Entry and Exit Points
- Entry Point: After the neckline breakout. Short for “Double Top”, long for “Double Bottom”.
- Stop-Loss: Above the second peak (short) or below the second bottom (long).
- Take-profit: Measure the height of the pattern (from peak/bottom to the neckline) and project it from the breakout point.
Step 5: Using Indicators
To increase accuracy on MEXC, apply:
- RSI: Overbought (above 70) for “Double Top,” oversold (below 30) for “Double Bottom.”
- MACD: Line crossover confirms the reversal.
- Volume: Increasing volume at the breakout is a key factor.
Real Trading Examples on MEXC
Example 1: “Double Top” on BTC/USDT
- Situation: On the daily chart of BTC/USDT, the price rises from $50,000 to $65,000 in 10 days. It reaches $65,000, pulls back to $60,000, rises again to $65,000, but does not break the level.
- Breakout: The price falls below $60,000 with an increase in volume.
- Action: You open a short position at $59,800 with a stop-loss at $65,500 and a target at $55,000 (pattern height – $5,000).
- Result: The price reaches $55,000, yielding an 8% profit.
Example 2: “Double Bottom” on ETH/USDT
- Situation: On the 4-hour chart of ETH/USDT, the price falls from $2,500 to $2,000 (first bottom), bounces to $2,200, then falls again to $2,000 (second bottom).
- Breakout: The price breaks $2,200 upwards with increasing volume.
- Action: You open a long position at $2,250 with a stop-loss at $1,950 and a target at $2,500 (height — $200).
- Result: The price reaches $2,500, yielding a 10% profit.
Example 3: False Signal on XRP/USDT
- Situation: On the 1-hour chart of XRP/USDT, the price forms a “double top” at $1.50. After the second top, it falls below the neckline ($1.40), but the volume doesn’t increase.
- Action: You open a short at $1.39, but the price moves back above $1.40.
- Result: The stop-loss is triggered at $1.45 with a 2% loss. This highlights the importance of volume confirmation.
Example 4: “Double Bottom” on SOL/USDT
- Situation: On the 1-day chart of SOL/USDT, the price falls from $150 to $120, forming the first bottom. After bouncing to $130, it falls again to $120.
- Breakout: The price breaks $130 upwards with increasing volume.
- Action: You open a long at $132 with a stop-loss at $118 and a target at $140.
- Result: The price reaches $140, yielding a 6% profit.
Advantages and Disadvantages of Patterns
Advantages
- Simplicity: “M” and “W” are easily recognized even by beginners.
- Versatility: They work on all timeframes and MEXC assets.
- Reliability: Confirmed breakouts often lead to strong movements.
Disadvantages
- False Signals: Without volume or indicator confirmation, the pattern may fail.
- Volatility: Sudden price jumps in the crypto market can distort formations.
- Subjectivity: Traders may define the neckline differently.
How to Increase Pattern Accuracy?
To minimize risks and enhance efficiency, use the following methods:
- Fibonacci Levels: The neckline or tops/bottoms often coincide with levels of 38.2%, 50%, or 61.8%.
- Trend Lines: Confirm the pattern by connecting trend points.
- Volume: An increase in volume at a breakout is a must for a reliable signal.
- News: Keep track of events (e.g., hard forks or regulatory decisions) that may influence the market.
- Testing: Analyze historical data on MEXC to refine your strategy.
Advanced Strategies on MEXC
Strategy 1: Leverage Trading
MEXC offers futures with leverage up to 200x. For example:
- During a “Double Top” on BTC/USDT, you open a short with 10x leverage. With a deposit of $100, your position is $1,000, increasing profits (and risks).
Strategy 2: Scalping on Low Timeframes
On a 5-minute chart, look for mini versions of patterns for quick trades. For example, on DOGE/USDT you can earn 1-2% in 10 minutes.
Strategy 3: Combination with Indicators
- RSI + “Double Top”: Overbought condition on the second peak strengthens the signal.
- Bollinger Bands + “Double Bottom”: A breakout of the upper band confirms a bullish momentum.
- Stochastic: Crossing in the overbought/oversold zone adds accuracy.
Strategy 4: Trading in a Sideways Market
If the market is ranging, a “double top” may signal a move to the lower boundary, and a “double bottom” to the upper. Use this for short-term trades.
Applying Patterns in Different Market Conditions
Bull Market
In strong growth conditions, a “double top” may be rare but very significant. For example, in 2021, Bitcoin formed a “double top” at $69,000, after which a correction began.
Bear Market
A “double bottom” often appears at the bottom of a bear trend. For example, in 2022, Ethereum formed a “double bottom” around $1,000, which preceded a recovery.
Sideways Market
In a range, patterns help trade from the boundaries. For example, in the BNB/USDT pair, a “double top” at $300 and a “double bottom” at $250 can be reversal points.
Tips for Traders on MEXC
- Practice on a demo account: MEXC offers a test environment to practice strategies.
- Use alerts: Set up notifications on charts to track breakouts.
- Manage risks: Limit losses to 1-2% of the deposit per trade.
- Analyze volatile pairs: SHIB/USDT, SOL/USDT, and other assets often form clear patterns.
- Keep a journal: Record trades for error and success analysis.
- Study timeframes: Compare patterns on 1H, 4H, and 1D for a full picture.
- Monitor liquidity: High liquidity on MEXC ensures accurate order execution.
Why is MEXC the best platform for trading patterns?
MEXC stands out among crypto exchanges due to:
- A wide range of pairs: More than 1,500 assets, including spot and futures.
- Advanced charts: Integration with TradingView for precise analysis.
- Low fees: 0% for makers on spot and minimal fees on futures.
- High Liquidity: Fast execution even in volatile markets.
- Mobile Application: Trade and analyze patterns on the go.
Conclusion
“Double top” and “double bottom” are not just chart patterns, but powerful tools for predicting trend reversals. They are easy to use, versatile, and especially effective in the volatile crypto market. On the MEXC exchange, these patterns become even more useful thanks to convenient charts, a wide selection of assets, and futures trading opportunities.
Start by analyzing popular pairs like BTC/USDT, ETH/USDT, or SOL/USDT, and test your skills on an MEXC demo account. Combine patterns with indicators, monitor volume, and manage risks — and you’ll be able to trade confidently in any conditions. Sign up on MEXC today to apply the “double top” and “double bottom” in real trading and unlock your potential in the cryptocurrency market!
Join MEXC and Get up to $10,000 Bonus!
Sign Up


