1.Introduction: Why Futures Trading Matters in 2026
Futures trading has become one of the most important instruments in the cryptocurrency market. As the crypto industry matures and liquidity deepens, futures contracts allow traders to participate in the market with flexibility that spot trading cannot provide. In 2026, futures trading is widely used not only by institutions but also by retail traders and beginners who want exposure to both rising and falling markets.
However, futures trading is also where most beginners lose money. The primary reasons are lack of education, misuse of leverage, emotional decision-making, and poor understanding of charts and indicators. Many new traders mistakenly believe futures trading is a fast way to become profitable, without realizing that it requires structure, patience, and risk control.
This article is written specifically for beginners. It explains futures trading step by step, using simple language, real trading logic, and practical formulas. The goal is not to create hype, but to help you develop professional trading habits that can protect your capital and improve consistency over time.
2.What Is Futures Trading?
Futures trading involves a contract that allows traders to speculate on the future price of an asset without owning it. In cryptocurrency markets, most traders use perpetual futures contracts, which do not have an expiry date and closely follow the spot price.
In futures trading, you can make money in two ways:
- By opening a long position when you expect the price to rise
- By opening a short position when you expect the price to fall
This flexibility is one of the biggest advantages of futures trading. However, it also introduces higher risk, especially because futures trading uses leverage.
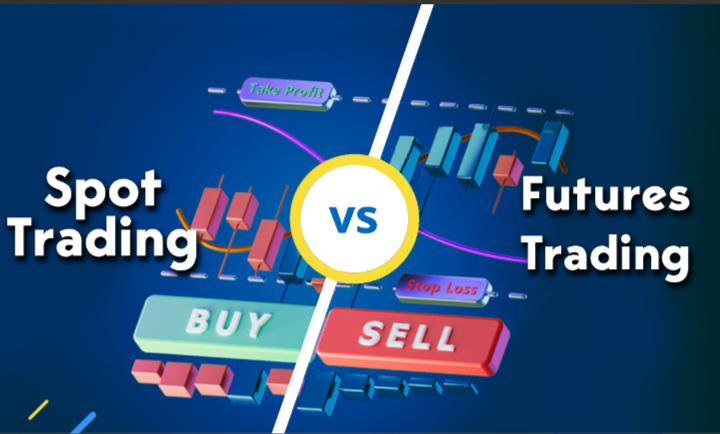
3.Futures Trading vs Spot Trading
Spot trading involves buying and owning an asset. Your profit depends solely on price appreciation. Futures trading, on the other hand, allows short selling, leverage, and hedging.
Because futures trading includes liquidation risk and margin requirements, it demands more discipline and planning. Beginners should treat futures trading as a skill to be learned gradually, not as a replacement for spot trading knowledge.
4.Understanding Leverage, Margin, and Liquidation
4.1 Leverage Explained (Beginner View)
Leverage allows you to control a larger position using a smaller amount of capital. For example, with 10x leverage, a $100 margin controls a $1,000 position. While this increases profit potential, it also magnifies losses.
A small price movement against your position can result in liquidation if leverage is too high. This is why beginners should start with low leverage, typically between 2x and 5x.
4.2 Margin Types
Isolated Margin: Only the margin allocated to the position is at risk. This is the safest option for beginners.
Cross Margin: Uses the entire account balance as collateral. While flexible, it increases risk and is not recommended for beginners.
4.3 Position Size Formula (Explained)
Position Size = Margin × Leverage
Example: If your margin is $100 and leverage is 5x: Position Size = 100 × 5 = $500
This means your profit or loss is calculated on $500, not $100.
5.Types of Futures Orders You Must Know
Market orders execute immediately at the best available price.
- Limit orders allow you to choose your entry or exit price and usually reduce fees.
- Stop-loss orders automatically close a losing trade, protecting your capital.
- Take-profit orders lock in gains when price reaches your target.
A professional habit every beginner must develop is setting stop-loss and take-profit orders before entering a trade.
6.Reading Futures Charts Like a Professional
6.1 Candlestick Charts Explained Simply
Technical analysis is the foundation of futures trading. Candlestick charts are the most commonly used charting method because they clearly display price action and market psychology. Each candlestick represents four data points: opening price, closing price, highest price, and lowest price within a given time period.
6.2 Timeframe Selection for Beginners
Timeframe selection is crucial. Lower timeframes provide more detail but contain more noise, while higher timeframes reveal stronger trends and key structural levels.
Higher timeframes (4H, Daily) show the main trend and strong support/resistance. Lower timeframes (5m, 15m) help refine entries. Beginners should always identify the trend on higher timeframes first.
7.Trend Analysis: Trading With Market Direction
Trends form the backbone of effective futures trading. An uptrend is defined by higher highs and higher lows, while a downtrend is defined by lower highs and lower lows. Sideways markets occur when price moves within a defined range.
Trading in the direction of the prevailing trend significantly improves probability. Counter-trend trades are riskier and require advanced confirmation. Beginners should prioritize trend-following strategies until they develop sufficient experience.
8.Essential Chart Patterns Every Beginner Must Know
8.1 Head and Shoulders
The Head and Shoulders is a classic bearish reversal pattern. It typically forms at the top of an uptrend and indicates that the bullish momentum is fading.
Structure:
- Left Shoulder: Price rises to a peak, then pulls back.
- Head: Price rallies to a higher peak than the left shoulder and then declines again.
- Right Shoulder: Price rises again but fails to reach the head level, signaling weakening buyers.
- Neckline: Connects the lows of the left and right shoulders; acts as support.
Trading Strategy:
- Entry: Short sell after the price breaks below the neckline and optionally retests it.
- Stop-Loss: Above the right shoulder to minimize risk.
- Target: Measure the distance from the head to the neckline and project it downward.
Tip: Volume often decreases during formation of the head and right shoulder and spikes during the breakout below the neckline.
8.2 Inverse Head and Shoulders
The Inverse Head and Shoulders is the bullish mirror of the head and shoulders pattern and signals a potential trend reversal from bearish to bullish.
Structure:
- Left Shoulder: Price drops to a low, then rebounds.
- Head: Price dips lower than the left shoulder and rebounds again.
- Right Shoulder: Price makes a higher low, signaling weakening sellers.
- Neckline: Connects the highs between shoulders and head; acts as resistance.
Trading Strategy:
- Entry: Buy after the price breaks above the neckline and retests it as support.
- Stop-Loss: Below the right shoulder.
- Target: Measure from the head to the neckline and project upward.

Tip: Volume should increase on the breakout above the neckline, confirming bullish strength.
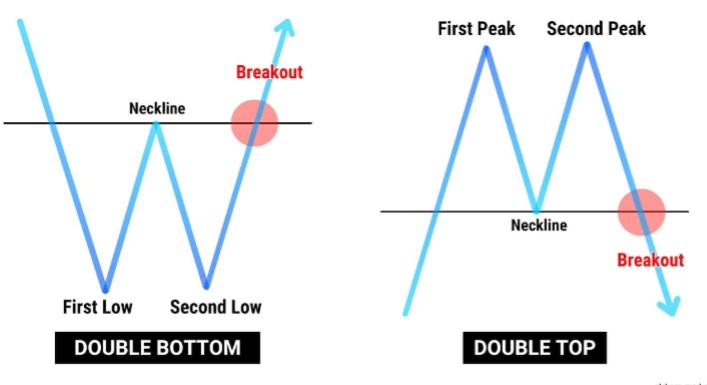
8.3 Double Top and Double Bottom
These are reversal patterns that indicate a shift in market momentum.
Double Top (Bearish):
- Forms after an uptrend when price hits resistance twice and fails to break higher.
- Confirmation occurs when price breaks below the valley between the two peaks.
- RSI divergence (lower highs while price makes equal highs) strengthens the signal.
Double Bottom (Bullish):
- Forms after a downtrend when price hits support twice and fails to break lower.
- Confirmation occurs when price breaks above the peak between the two lows.
- RSI divergence (higher lows while price makes equal lows) adds reliability.
Trading Strategy:
- Entry: After breakout confirmation above/below the middle point.
- Stop-Loss: Just beyond the nearest peak or trough.
- Target: Measure the height from top to bottom and project in breakout direction.
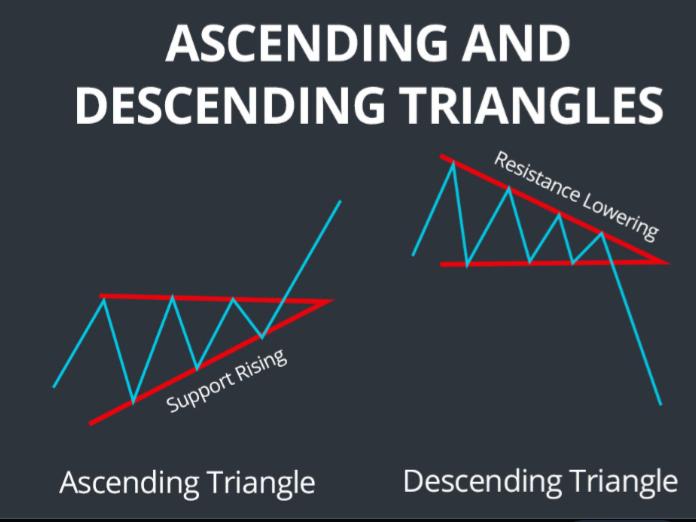
8.4 Ascending and Descending Triangles
Triangles are continuation patterns that often indicate the market will resume its trend after a brief consolidation.
Ascending Triangle (Bullish):
- Flat resistance at the top, rising trendline at the bottom.
- Buyers gradually gain strength, testing resistance multiple times.
- Entry: On breakout above resistance.
- Target: Measure the triangle’s height and project upward.
Descending Triangle (Bearish):
- Flat support at the bottom, descending trendline at the top.
- Sellers become more aggressive, testing support repeatedly.
- Entry: On breakout below support.
- Target: Height of triangle projected downward.
Tip: Volume usually contracts during the triangle formation and spikes at breakout.
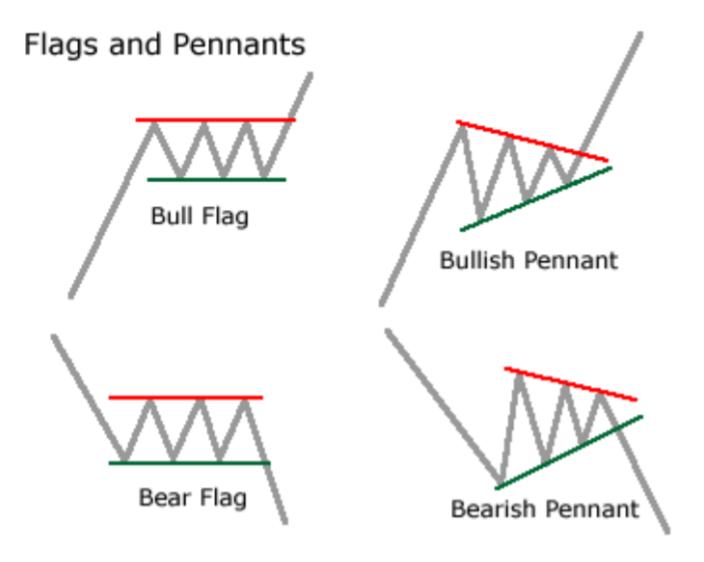
8.5 Flags and Pennants
Short-term continuation patterns that appear after strong moves:
Flags:
- Rectangular consolidation against the trend (up or down).
- Often slope slightly opposite to the prevailing trend.
Pennants:
- Small symmetrical triangles formed after sharp price movement.
- Converging trendlines resemble a miniature triangle.
Trading Strategy:
- Entry: Buy/sell in the direction of the original trend after breakout.
- Stop-Loss: Just below/above the flag or pennant.
- Target: Measure the flagpole (initial move before consolidation) and project from breakout.
Tip: Strong volume during the initial move and lower volume during consolidation improves reliability.
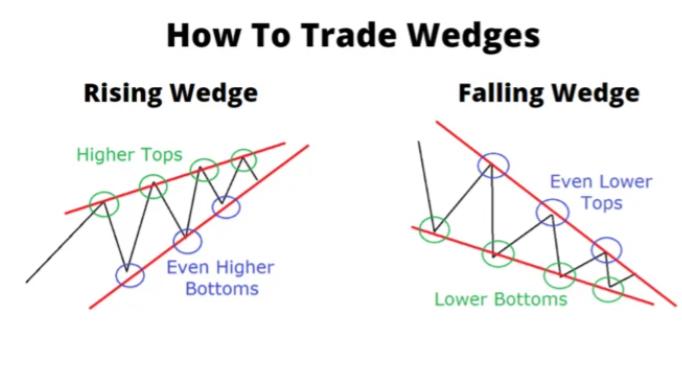
8.6 Wedge Patterns (Rising and Falling)
Wedges are powerful reversal patterns that signal a potential trend change.
Rising Wedge (Bearish):
- Price rises with converging trendlines.
- Often occurs after an uptrend, signaling a slowdown in bullish momentum.
- Entry: Short sell on a breakdown below the lower trendline.
- Target: Height of wedge projected downward.
Falling Wedge (Bullish):
- Price declines with converging trendlines.
- Often occurs after a downtrend, signaling weakening sellers.
- Entry: Buy on breakout above the upper trendline.
- Target: Height of wedge projected upward.
Tip: Look for decreasing volume inside the wedge and a surge at breakout to confirm the move.
9.Indicators Used in Effective Futures Trading
9.1 Moving Averages (MA)
Moving averages are used to identify trend direction and dynamic support or resistance levels in the market. The Simple Moving Average (SMA) is calculated by summing the closing prices over a set number of periods and dividing by that number, giving a smooth line that reflects the average price. Exponential Moving Averages (EMA) give more weight to recent prices, making them more responsive to current price changes and useful for spotting pullback entries during trends.
Trading Strategy: Traders often use moving averages to identify trend direction — buying when price is above a rising MA or selling when price is below a falling MA. Pullback entries using EMAs can improve timing in trending markets.
9.2 Bollinger Bands
Bollinger Bands measure market volatility by plotting an upper and lower band around a moving average. The formula is:
Upper Band = MA + (Standard Deviation × Multiplier)
Lower Band = MA – (Standard Deviation × Multiplier)
Price touching the upper or lower band indicates volatility extremes but does not automatically signal a reversal. Bollinger Bands are often combined with other indicators like RSI or MACD to confirm potential entries or exits.
Trading Strategy: Buy near the lower band in an uptrend and sell near the upper band in a downtrend. Look for breakouts when bands expand after a period of contraction.
9.3 Relative Strength Index (RSI)
The Relative Strength Index (RSI) is a momentum oscillator that measures the speed and change of price movements. The formula is:
RSI = 100 – [100 / (1 + RS)], where RS = Average Gain ÷ Average Loss over a set period.
RSI ranges from 0 to 100, with readings above 70 suggesting overbought conditions and readings below 30 indicating oversold conditions. Divergence between RSI and price can signal weakening trends and potential reversals.
Trading Strategy: Traders use RSI to identify potential entry and exit points ,buying when oversold and selling when overbought, ideally confirming with other indicators.
9.4 MACD (Moving Average Convergence Divergence)
MACD is a momentum indicator that shows the relationship between two moving averages. It consists of the MACD line (difference between a fast EMA and slow EMA), the signal line (usually a 9-period EMA of the MACD), and a histogram showing the distance between the two.
Trading Strategy: A bullish signal occurs when the MACD line crosses above the signal line, while a bearish signal occurs when it crosses below. Divergence between MACD and price can indicate trend weakening or potential reversal.
9.5 Support and Resistance
Support and resistance are key price levels where the market tends to pause or reverse. Support is a price level where buying pressure is strong enough to prevent the price from falling further, while resistance is a level where selling pressure prevents the price from rising higher. These levels can be identified using previous highs and lows, trendlines, moving averages, or pivot points.
Trading Strategy: Traders often buy near support and sell near resistance. Breakouts above resistance or below support can signal a strong continuation in the breakout direction, with entry taken after confirmation and stop-loss placed just beyond the level.
10.Indicator Combinations for Beginners (With Clear Explanations)
10.1 RSI + Support and Resistance
When RSI indicates oversold conditions near a strong support level, it often signals a potential price bounce. Conversely, overbought RSI near resistance may signal a short opportunity. This combination helps confirm entry points rather than relying on RSI alone.
10.2 EMA + Trend Structure
Price staying above key EMAs during an uptrend confirms bullish strength. Pullbacks to the EMA often provide low-risk entry points. Similarly, price staying below EMAs in a downtrend confirms bearish strength.
10.3 Bollinger Bands + Volume
A breakout outside Bollinger Bands combined with rising volume indicates a strong continuation of the trend. A breakout with low volume is more likely to be a false signal. This combination helps traders filter high-probability trades.
10.4 MACD + RSI Confirmation
MACD crossovers indicate momentum changes, while RSI shows overbought/oversold levels. When both signals align in the same direction, the probability of a successful trade improves. Beginners can use this combination to reduce false signals and increase confidence.
10.5 EMA + RSI + Candlestick Patterns
For stronger confirmation, combine EMA trend direction, RSI momentum, and a supporting candlestick pattern (like a bullish engulfing at support or a bearish engulfing at resistance). This three-layer confirmation improves entry accuracy.

11.Profit, Risk, and Money Management Formulas (Explained for Beginners)
11.1 Profit and Loss (PnL)
Profit and Loss (PnL) measures how much you earn or lose on a trade. The formula is:
PnL = (Exit Price – Entry Price) × Position Size
For short positions, the calculation is reversed. It is important to always calculate the potential loss before entering a trade to manage risk effectively.
Trading Strategy: Use PnL calculations to estimate potential profits and losses for each trade, ensuring that the reward justifies the risk before entering.
11.2 Risk Per Trade Formula
Risk per trade determines how much of your account you are willing to risk on a single position. The formula is:
Risk Per Trade = Account Balance × Risk Percentage
For example, a $1,000 account with a 1% risk per trade allows a maximum loss of $10.
Trading Strategy: Set your risk percentage according to your comfort level and trading style. Consistently applying this formula prevents a single loss from significantly damaging your account.
11.3 Stop-Loss Distance Formula
The stop-loss distance formula helps determine position size in accordance with risk tolerance:
Position Size = Risk Amount ÷ Stop-Loss Distance
This ensures that your trade size aligns with the maximum loss you are willing to take.
Trading Strategy: Use this formula to calculate precise position sizes for each trade, keeping losses controlled and consistent.
11.4 Risk-to-Reward Ratio
The risk-to-reward ratio compares potential profit to potential loss and helps evaluate whether a trade is worth taking:
Risk-to-Reward = Potential Profit ÷ Potential Loss
For example, a 1:2 ratio means risking $10 to make $20.
Trading Strategy: Aim for trades with higher potential reward than risk. A minimum ratio of 1:2 is often recommended to maintain profitability over time.
11.5 Break-Even Win Rate Formula
The break-even win rate formula tells you how often you need to win to avoid losing money:
Break-Even Win Rate = 1 ÷ (1 + Risk-to-Reward)
This helps traders understand the minimum success rate required to remain profitable.
Trading Strategy: Use the break-even win rate to set realistic expectations and adjust your strategy if your win rate is below the required threshold.

12.Common Futures Trading Mistakes Beginners Make
Overleveraging is the most common mistake in futures trading. Beginners often use excessive leverage, leaving no room for price fluctuation. Ignoring stop-losses, trading based on emotion, and overtrading during low-quality setups further compound losses.
Successful futures trading requires patience, selective execution, and consistency rather than constant market activity.
13.Advantages of Using MEXC for Futures Trading
Selecting the right trading platform is a critical component of futures trading success. In 2026, MEXC has established itself as a strong choice for futures traders by offering a balance of liquidity, flexibility, and user-focused tools.
MEXC provides deep liquidity across a wide range of futures pairs, enabling efficient order execution with reduced slippage. This is particularly important in leveraged trading, where execution quality directly affects outcomes. The platform offers adjustable leverage settings, allowing beginners to start conservatively while giving experienced traders room to scale responsibly.
MEXC also supports both isolated and cross margin modes, making risk management more intuitive. Competitive trading fees and frequent incentives help reduce overall trading costs, which is crucial for active futures traders. Combined with a user-friendly interface, real-time risk indicators, and strong security infrastructure, MEXC creates an environment well-suited for applying disciplined futures trading strategies.

14.Final Thoughts: Trading Futures Successfully in 2026
Futures trading is a skill developed through education, patience, and discipline. By understanding charts, patterns, indicators, and formulas,and by respecting risk,beginners can turn futures trading into a long-term opportunity rather than a costly mistake.
Disclaimer: This content is for educational and reference purposes only and does not constitute any investment advice. Digital asset investments carry high risk. Please evaluate carefully and assume full responsibility for your own decisions.
Enjoy Most Trending Tokens, Everyday Airdrops, Xtremely Low Fees and Comprehensive Liquidity!
Sign Up App Store
 Android APK