


Hello friends and enthusiasts of the crypto world! In this series of articles that I want to cover weekly, we will analyze and predict the price of Bitcoin (BTC) and Ethereum (ETH) together. Two giants of the cryptocurrency market that are always in the spotlight. Each week, based on fresh data and market trends, we will provide analyses to help you make smarter decisions, especially you who are using the MEXC exchange for trading. If you want to keep up with the upcoming articles, be sure to check the blog [official blog of MEXC exchange] because the crypto market never sleeps, and we are with you weekly!
In this article, we will first examine the fundamental factors, that is, the economic, news, and structural factors that influence prices. Then, we will move on to technical analysis, where we will make short-term and long-term predictions using charts, indicators, and patterns. Now, let’s get started.
1. Bitcoin BTC Fundamental Analysis
1.1 Economic Factors and Monetary Policies
In recent weeks, the crypto market has been influenced by decisions from the U.S. Central Bank (Federal Reserve). Reports indicate that the Federal Reserve held a meeting in late August 2025 and provided positive signals for an interest rate cut in October. This news, which directs markets towards riskier assets like Bitcoin, has led to an increase in demand for BTC last week. With the current price around $110,000, this policy could support growth up to $115,000 in the short term or even reaching the previous peak of around $124,000, especially if global inflation remains above 3%. Historically, September is considered a weak month for Bitcoin, with an average negative return of 5 to 7 percent recorded in this month.
1.2 Company News and Institutional Accumulation of ETFs
August 2025 was a tough month for Bitcoin ETFs. In this month, the total net outflow reached about $750 million, and the positive four-month trend of capital inflow came to a halt. This capital outflow exerted severe downward pressure on the price, especially on August 29, when $126.8 million was withdrawn from Bitcoin ETFs in just that one day. On September 2, the net capital inflow into Bitcoin spot ETFs reached $332.9 million. The Fidelity fund with the symbol FBTC recorded the highest inflow, attracting $132.7 million in capital.
1.3 Global and Geopolitical Events
In the geopolitical arena, new negotiations between the United States and China to reduce tariffs in September 2025 have brought relative stability to financial markets. This could direct investors towards safe-haven assets like gold and Bitcoin. Additionally, reports from an Asian country intending to consider Bitcoin as part of its national reserves have created a positive market sentiment, although it has not yet been officially confirmed.
However, the issue of the Russia-Ukraine war continues to sway public opinion towards purchasing safe-haven assets like gold. Nevertheless, in the week ending in August, according to HODL15Capital data, a total of 19 companies added to their Bitcoin reserves.
1.4- Blockchain Innovations and Adoption
From a technological perspective, recent updates to the Bitcoin blockchain, such as scalability improvements with layer two protocols (like the Lightning Network), have reduced fees and increased transaction speeds. These innovations, along with announcements from technology companies regarding the integration of Bitcoin into everyday payments, could enhance adoption. This week, a large online payment company announced that by the end of 2025, it would accept Bitcoin as a payment method, which could further increase demand.
2 Technical Analysis of Bitcoin BTC
2.1 Support and Resistance Levels
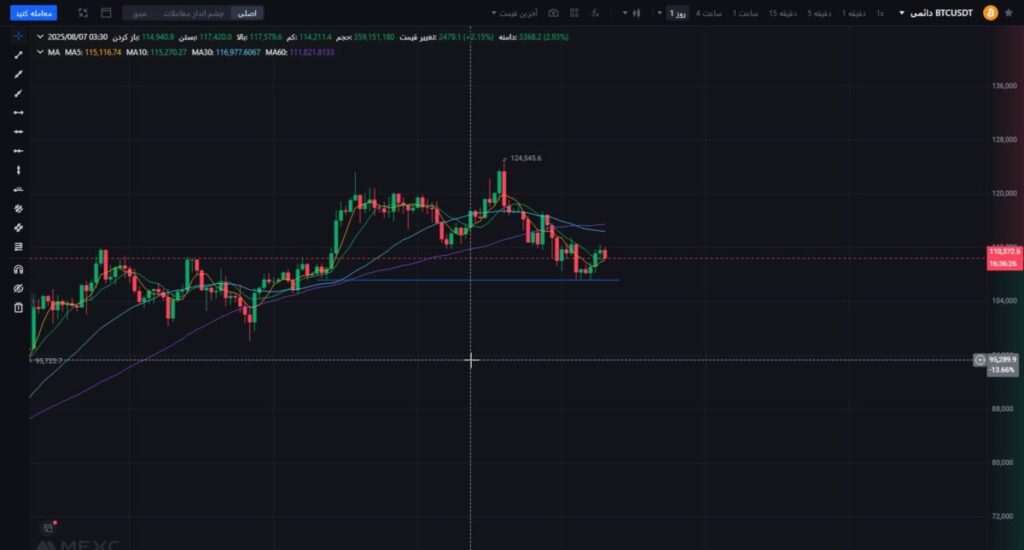
Support: The chart shows the level of key support in the range of 98,000 to 103,000 dollars. This level was tested in late June and early August and acted as a strong floor.
Resistance: The nearest resistance is in the range of 117,000 to 117,387 dollars. If the price breaks through this level, it could advance to 124,000 dollars (the peak in August 2025). A stronger resistance is seen at 130,000 dollars.
The current price of Bitcoin (according to the chart) is around 111,000 dollars, fluctuating between support and resistance. This position shows the market in a temporary state of equilibrium.
2.2 Moving Average
In the chart Exchange MEXC we used two simple moving averages (SMA): a short-term SMA (20 days) and a long-term SMA (50 days).
Bullish: The short-term SMA line is above the long-term SMA and both are moving upward, indicating a bullish macro trend.
Cross: The recent crossover of the SMAs in mid-August gave a buy signal that brought the price to 111,000 dollars. If this trend continues, we can expect growth to 115,000 dollars.
2.3 – MACD Indicator
The MACD line (blue) is above the signal line (orange) and the histogram has turned positive, indicating bullish momentum.
Analysis: The gap between the MACD and signal lines is narrowing, which may indicate a decrease in momentum. If the MACD line goes below the signal, we might see a correction to 107,000 dollars.
Prediction: By September 11, if the histogram remains positive, a rise to 113,000 dollars is probable.
2.4 Relative Strength Index (RSI)
The current RSI is around 45-50 (close to the neutral level of 50), indicating that the market is neither in the overbought nor oversold territory.
Analysis: In late August, the RSI had reached 60, but now it’s returning towards 50, which could indicate signs of price stabilization. If it goes below 30, support at $98,000 will activate; if it goes above 70, resistance at $117,000 will be tested.
Prediction: In the upcoming week, RSI it is likely to fluctuate between 45 and 55, which indicates a continuation of the trend without excess.
2.5- Price Patterns
The chart shows an ascending triangle pattern from mid-August to now, which usually provides a bullish signal. A breakout of this pattern upwards (above $117,000) could activate a target of $124,000.
Risk: If the price goes below $103,000, the pattern will be invalidated and it may correct to $98,000.
2.6- Upcoming Scenarios
Bullish Scenario: If Bitcoin breaks above $115,000, it could rise to $124,000. This scenario is supported by MACD momentum and SMA.
Bearish Scenario: If support at $103,000 breaks, a correction to $98,000 is probable, especially if the RSI goes below 40.
Weekly Forecast: Considering the current balance ($111,000), it is expected that the price will fluctuate between $107,000 and $113,000, unless strong fundamental news shakes the market.
3- Fundamental Analysis of Ethereum ETH
3.1 Economic Factors and Monetary Policies
The Ethereum market, like Bitcoin, has been affected by decisions from the Federal Reserve of the United States. In late August 2025, signals of rate cuts were released in October, which injects more liquidity into the crypto market. This, along with reports of Eurozone inflation dropping to 2.8%, has led investors to show greater interest in assets like Ethereum. With the current price around $4,450, this policy could boost demand and push the price to $4,550 to $4,650 in the short term.
3.2 Company News and Institutional Accumulation
Investment The Ether Machin: This digital asset company raised $654 million by attracting 150,000 Ethereum ETH units in August 2025. Along with its previous investments, approximately $800 million by one of the company’s co-founders, currently holds 495,363 Ethereum.
One of the significant news is the increase in Ethereum reserves by large financial institutions. For instance, Goldman Sachs announced in late August that it added 160,072 ETH (equivalent to $721 million) to its investment portfolio, indicating confidence in the Ethereum ecosystem. Additionally, BitMine Immersion Technologies remains the largest corporate holder of Ethereum with 1.87 million ETH (over 1.5% of the total supply). These accumulations, along with a $90 million influx into Ethereum ETFs last week, could drive prices toward higher levels.
The entry of capital into Ethereum spot ETFs approved and accepted by the SEC since July 2024 has seen significant capital inflow. In the seven trading days of July 2025, approximately $1.5 billion and a total of over $8 billion in institutional capital were attracted. These inflows reflect the growing acceptance of Ethereum ETH as a legitimate and tradable asset.
3.3 Global and Geopolitical Events
In the geopolitical realm, the relative stability created by the trade negotiations between the U.S. and China in September 2025 has encouraged investment in digital assets. Furthermore, a European country recently announced that it is reviewing blockchain adoption regulations, including Ethereum, for government transactions. This news, published on September 2, has created a positive psychological environment and could increase the acceptance of Ethereum in the public sector.
3.4 Blockchain Innovations and Adoption
In terms of technology, Ethereum has progressed in the past few months with key updates like Pectra (testing phase in August 2025). This update, which improves scalability by reducing gas fees, has encouraged developers to launch more applications. For example, a major DeFi platform announced on September 3 that it has reduced transactions by 30% using Pectra. These innovations, along with a 15% growth in the number of users on the network in Q3 2025, indicate increasing adoption of Ethereum.
3.5 Market flows and stablecoins
Liquidity flows in Ethereum ETH are also significant. Reports show that the volume of USDT on the Ethereum network has exceeded $60.3 billion, surpassing competitors like Tron. This increase, confirmed in early September, has strengthened liquidity in the Ethereum ecosystem and could support prices. Additionally, a 38% outflow of Ethereum supply from centralized exchanges, starting in 2022, has reduced selling pressure.
4 Technical analysis of Ethereum ETH
4.1 Support and resistance levels
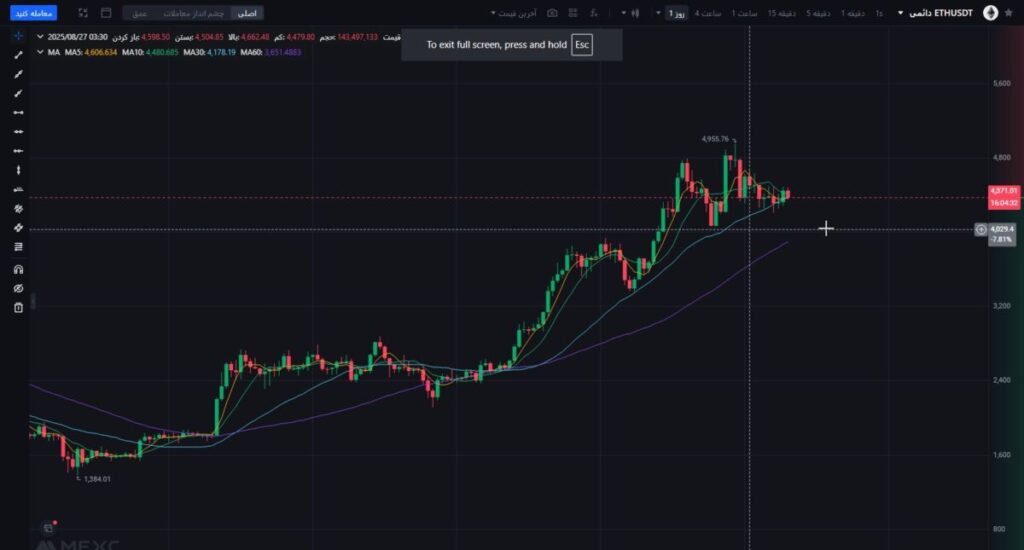
Support: According to the above chart, Ethereum shows a key support level in the range of $4,200 to $4,300. This level was tested in late August and has acted as a strong floor.
Resistance: The nearest resistance is in the range of $4,600 to $4,700. If the price breaks above this level, it could go up to $4,950 (the peak of August 2025). A stronger resistance is also seen at $5,200.
The current price of Ethereum (according to the chart) is around $4,450, which is close to the midpoint support and indicates potential growth with suitable momentum.
4.2- Moving Average
In the MEXC exchange chart, we used two SMAs: a short-term SMA (20-day) and a long-term SMA (50-day).
Bullish: The short-term SMA is above the long-term SMA, and both are moving upwards, confirming a macro bullish trend.
Cross: The recent crossover of the SMAs in mid-August gave a buy signal and brought the price to $4,450. Continuation of this trend could allow for growth to $4,600.
4.3- MACD Indicator
The MACD line (blue) is above the signal line (orange) and the histogram has turned positive, indicating bullish momentum.
Analysis: The distance between the MACD and signal lines has decreased, which could indicate signs of momentum stabilization. If the MACD line moves below the signal, a correction to $4,300 is possible.
- Prediction: By September 11, if the histogram remains positive, growth to $4,600 is expected.
4.4- Relative Strength Index (RSI)
The current RSI is around 48-52 (close to a neutral level of 50), indicating that the market is balanced, neither overbought nor oversold.
Analysis: In late August, the RSI reached 65, but has now receded towards 50, confirming price stabilization. If it drops below 30, support at $4,200 will activate; if it rises above 70, resistance at $4,700 will be tested.
Prediction: In the upcoming week, the RSI is likely to fluctuate between 45 and 55, predicting trend continuation without excess.
4.5- Price Patterns
The chart shows a bullish flag pattern from mid-August to now, which typically targets a 10-15% rise after a breakout upwards. A breakout of this pattern above $4,700 could activate a target of $4,950.
Risk: If the price drops below $4,300, the pattern will be invalidated and it may correct down to $4,000.
4.6- Upcoming Scenarios
Bullish Scenario: If Ethereum breaks above $4,700, it could rise to $4,950. This scenario is supported by the MACD and SMA momentum.
Bearish Scenario: If support at $4,300 is broken, a correction to $4,000 is likely, especially if the RSI drops below 40.
Weekly Forecast: Considering the current balance ($4,450), the price is expected to fluctuate between $4,350 and $4,600, unless a strong fundamental news changes the market.
Disclaimer: The information provided in this article should not be considered as investment advice and should not be used as a basis for financial decision-making. Investing in cryptocurrencies carries a high market risk. Please trade with caution. MEXC exchange assumes no responsibility for any potential losses.