واحدة من أكثر الاستراتيجيات احتراما واختبارا على مر الزمن في التحليل الفني هي طريقة ويكوف— نهج تداول تم تطويره بواسطة تقني سوق الأسهم الأسطوري ريتشارد د. ويكوف في الثلاثينيات. تعتمد هذه المنهجية على فهم دورات السوق من خلال العلاقة بين حركة السعر وحجم التداول، مما يساعد المتداولين على توقع تحركات السوق المحتملة بثقة أكبر.

لكن كيف تعمل طريقة ويكوف في سوق الكريبتو المتقلب اليوم؟ هل يمكن لأداة تم بناؤها قبل ما يقرب من قرن من الزمن أن توجه المستثمرين في الكريبتو العصريين؟ دعونا نغوص في أساسيات نمط ويكوف وكيف يمكنك استخدامه لتحسين استراتيجيتك في التداول.
ما هو نمط ويكوف؟
طريقة مثبتة وتثبت فاعليتها في توقع تحركات السوق، حيث تقوم طريقة ويكوف بتحليل أنماط السعر والحجم لتزويد المتداولين بهذه القدرة. تم تطويرها في الثلاثينيات بواسطة ريتشارد ويكوف، توفر هذه الطريقة تحليلاً عميقاً لميكانيكيات حركة السعر وعلم نفس السوق.
الإيمان الأساسي لويكوف هو أن اللاعبين الأقوياء يتحكمون في العرض والطلب في الأسواق لصالحهم. يمكن للمتداولين التعرف على هذه الأنماط وتوقع نقاط التحول في السوق من خلال دراسة مخططات الأسعار، وت variations في الحجم، والنشاط في السوق.
تأسس ثلاث مبادئ أساسية على أساس الطريقة:
تلاعب السوق
اقترح ويكوف أن المؤسسات الكبيرة غالباً ما تتلاعب بالسوق لتجميع أو تفريغ مراكزهم دون لفت الانتباه. تخلق هذه التلاعبات أنماطاً يمكن التعرف عليها يتعلم المتداولون كيفية تحديدها.
العرض والطلب
التبادل بين البائعين والمشترين يحافظ على حياة السوق. يؤكد ويكوف أن الفجوات بين العرض والطلب تخلق إمكانية للتقلبات السعرية الكبيرة.
المستثمرون المؤسساتيون
تؤثر هذه الأفكار، المعروفة بشكل شائع باسم
Wyckoff Method Phase
There are four main stages to the Wyckoff Pattern: accumulation, uptrend, distribution, and decline. Below is a summary of every stage:
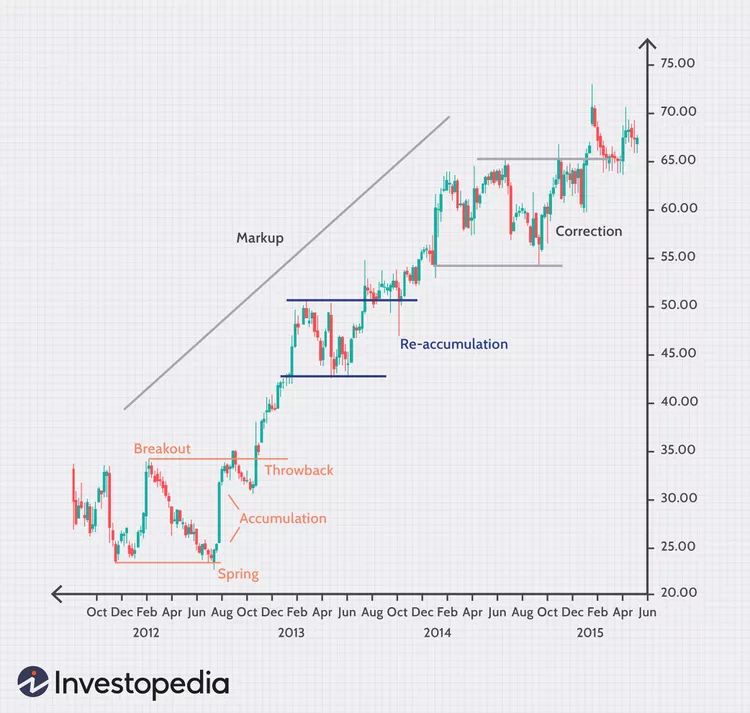
Accumulation and Markup Phase
Accumulation using the Wyckoff method is the initial phase, characterized by sideways price movement within a specific timeframe. While appearing stagnant, some large investors are quietly accumulating assets.
Once buying pressure surpasses selling pressure, a Markup Phase begins, marked by a decisive breakout above the accumulation range. Subsequent pullbacks, or “throwbacks,” offer potential entry points for traders.
The Markup Phase may include brief consolidation periods known as “reaccumulation zones,” allowing the market to recharge.
However, a consistent failure to create new highs after pullbacks signals potential uptrend weakness and a possible transition to the distribution phase.
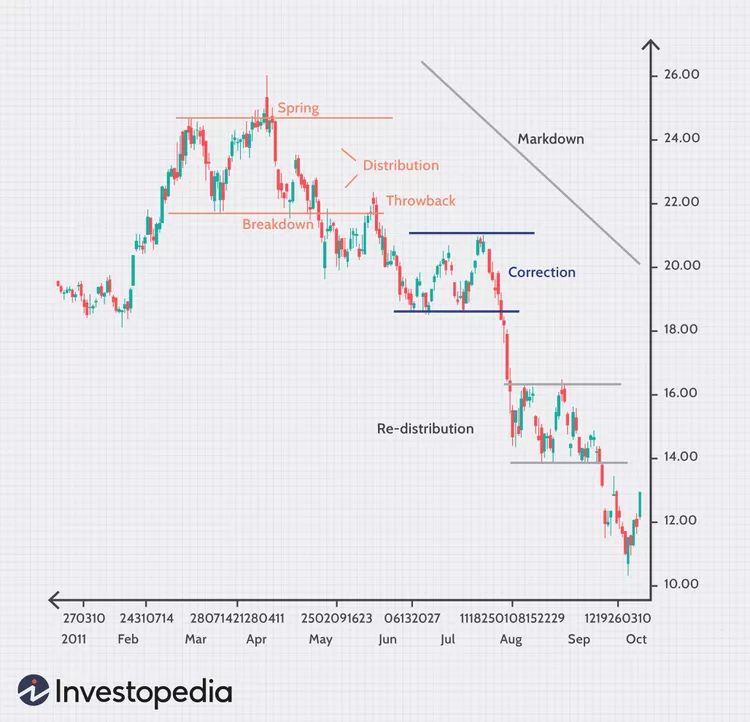
Distribution and Markdown Phase
After the market’s climb, a subtle change happens as experienced investors quietly unwind their positions. A narrow trading range emerges, concealing the fundamental distribution process.
Prices fluctuate within a narrow range, attracting new, generally less sophisticated investors. However, as selling pressure increases, this façade of steadiness begins to shatter.
Prices begin to fall, interrupted by brief rallies that can be deceiving. Astute traders see these as opportunities to quit or short the market.
Finally, a redistribution phase occurs, characterized by significant selling and price reductions, culminating in a market bottom. This period is distinguished by heightened volatility as panic selling grips the market and investor sentiment changes rapidly.
How To Identify and Read Wyckoff Pattern?
To effectively interpret the Wyckoff Pattern, it’s crucial to identify when a breakout occurs during the accumulation phase.
As previously explained earlier, this breakthrough signals the conclusion of the accumulation phase and the start of a substantial price increase.
Here are some key indicators that can help to identify and confirm the breakout:
- Spring or Shakeout: A rapid price decrease before the breakout, known as a spring or shakeout, might help to eliminate weaker market participants, laying the groundwork for an upward surge.
- Volume Confirmation: The breakout’s significance is reinforced by the increased trade volume that accompanies it. This rise implies increased buying demand, which increases the chance of a long-term rise. However, reduced volume during future pullbacks can be bullish.
- Price Action: A significant move over the previous resistance level is required for a confirmed breakout. Technical indicators like trendlines and moving averages might provide extra proof.
- Backing-Up Action: A transient market pullback to the newly created support level (former resistance) following a breakout, known as backing-up action, might strengthen the breakout’s legitimacy. A successful retest of this level would support the bullish picture.
Can the Wyckoff Method Used In Crypto Trading?
Absolutely. In fact, the Wyckoff Method aligns perfectly with the behavior of the crypto markets, which are often driven by emotion, speculation, and sudden shifts in sentiment.
The method’s focus on market psychology, volume dynamics, and institutional behavior makes it a powerful tool for navigating Bitcoin, Ethereum, and altcoin charts.
Many large crypto price moves—including Bitcoin’s major bull runs—exhibit clear Wyckoff patterns in hindsight. With training and discipline, you can start spotting them in real time.
How To Use Wyckoff Pattern On Crypto Trading?
To implement the Wyckoff Method effectively in crypto:
- Practice Patience: The Wyckoff Method works best over time. Avoid FOMO and wait for confirmation of each phase.
- Study the Market Structure: Learn to identify accumulation and distribution zones on major timeframes (4H, daily, weekly).
- Use Volume Analysis: Crypto exchanges offer detailed volume data. Watch how it behaves around support and resistance.
- Combine with Technical Indicators: Use trendlines, moving averages (e.g., 50MA/200MA), and RSI to confirm setups.
- Track Smart Money Activity: Look for large volume spikes, sudden reversals, and fakeouts around key levels.
Personal Note From MEXC Team
Check out our MEXC trading page and find out what we have to offer! There are also a ton of interesting articles to get you up to speed with the crypto world. Lastly, join our MEXC Creators project and share your opinion about everything crypto! Happy trading! Learn about interoperability now!
استمتع بأكثر العملات رواجًا، والإيردروب اليومي، والرسوم المنخفضة للغاية، والسيولة الشاملة
اشتراك