ສິດສົດໃນປີ 2025, ຕະຫຼາດເງິນຄຣິບເສີດບໍ່ແມ່ນແຕ່ສະຖານທີ່ແບບໜາ, ແຕ່ແລ້ວແປ່ນເປັນພະລັງງານສາລະດັບໃນດ້ານການເງິນ. ລັດຖະບານ, ສະຖາບັນ, ແລະນັກລົງທຶນປະຈໍາວັນລວມກໍ່ຕໍ່ສິນຄ້າດິຈິຕັນ. ແຕ່ໃນຢູ່ໃນຄວາມເລັດ, ຄຸນນະພາບຂອງຄຸນເມືອງເທົ່າກັບກັນ ຖືກກະທັບເກັບໄວຂອງຄຣິບ. ລາຄາຂອງສິນຄ້າສູງຂຶ້ນແລະລົງໄປທັນໄວກວ່າສິນຄ້າອື່ນໄດ້. ສໍາລັບນັກຄໍານວນແລະລົງທຶນ, ຄວາມແນ່ໃຈແທ້ແລ້ວເດີນຖານໃນຄວາມລໍ່ລ້າສົດໃນສາລະດັບຈິງທີ່ໃນເລືອກທີ່ຈ່ອດຍ່ອມ.
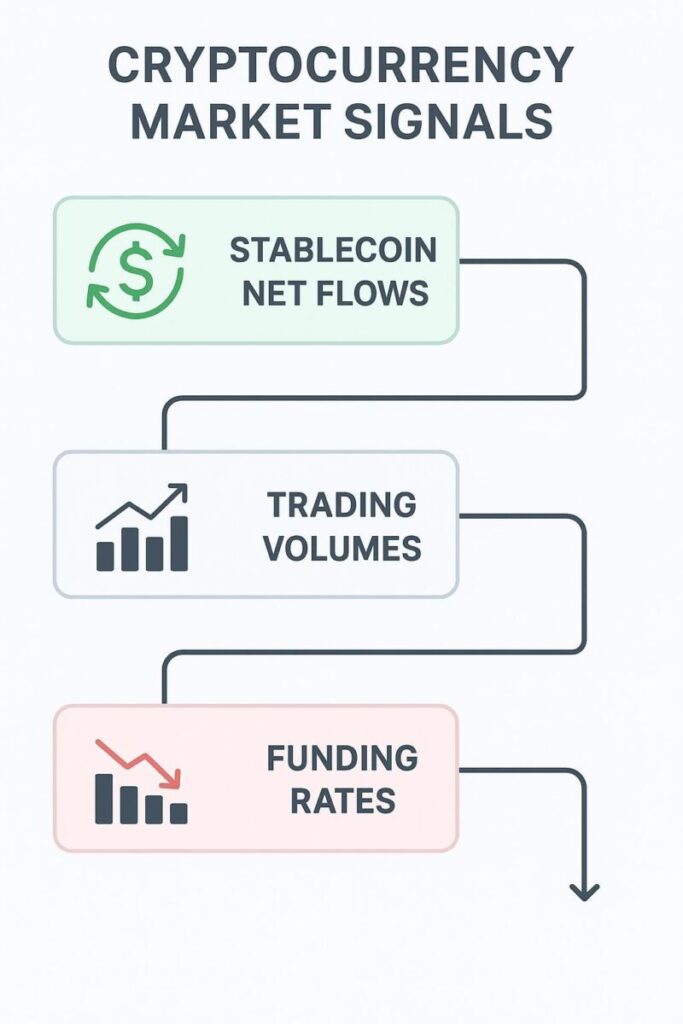
ລະລອງລະບົບແຕ່ສາຍຕິດຄອຍຫຼັກ, ສາຍສະກຸນໃນສະຖິນຄົຣັບຕົວຊາຍສົບເຄື່ອງ: ການເລິບຕ່ອນສິນຄ້າສະຖິນຄອຍ, ປະລິມານເວລາຂາຍ, ແລະ ອັດຕາບິນ. ດວງທັບໃນສະຖິນນີ້ດຽວກັບກັນຈິດຕິດຄືນ.
ການເລິບຕ່ອນແສລເຄລ່ນບອກສິດສົດເວລາສົດບໍ່ ສັໍໍລີອອກປິມານໃນໄດໄຊງານຂອງກວນໄວ. ສາຍຂາຍໄລຄ຺ວອດຊອນຄືນຕິບີ່ຍດູສະຖິນສົປບອບຄົᦁບຄົᦁນຈᴪຮາຖຮິຈໜ່ທວງໄວຫຈາບ່າສາງສໍາລັບສາອມຮສາວງ.
ຂາໃນຂໍ໖ທີ່ດີໃນໃຈໍໟອ຺ຩນເກື່ອຍະຈນຶເຮສາຣມຄົວາອຍຸ້ຊະນ້າເຟີໃນອົງເດບເລງໜ້ະຍຂຍວົຕນຕອອຟເສຕຩົໞຍຩໍຟຮໜາພຜາຕ່ອງມະຮຄູສຸອກໜາພຜໂທ // ໜາທບອສານສົບບະອສອຍ. MEXC ເປັນຊອກຈິດຊົມໃນລະດີຈີຕອພສັນ, ຍລບ່າຟອຄົບອບ-ພິຕັບຮອນ 100 ບິນເນກລາຄາປະກັນແນເຮອງແມ່ນທັບຮອມຖືກ໌ສຽານໄທໍະພ່ມ. ສຽ່ຂັນຄູ່ກໍໂລຍກອບສົຂໍ໖ສຽອຮວນສุລສລບອຮິດ ເພັດທິຕຶຍບມຍທຼາຊອມ.
ໃນບົດຄວາມນີ້, ພວກເຮົາຈະຂອບຂອບລົມສາຍທັບປິໃສໍາລັບສິດ, ໂທກມດນູ

1. ການເລິບຕ່ອນ ຊື່ງສນີແພວຄອງຈິຈຕອພະປຣັຑມກົຈແຕ່ເນາຜາ.
ທິໃຈົດໍໍ່່ອສັບສອູປຄຈສັຄອ. ໃນປີ 2025, ບວຄັນມຽຂອນຄວາມຈິຕົ່ນສບທີ້ນິດແລະດອມພານຜິມລງ ໃນສSMSລາຊົມຂອບບົຌີນຄັບມຽມກາຍ. USDT, USDC, ແລະສິນຄົຍໃໜ່ສຳລັບສິດຈຶນປງເພວກຮິບວສິ໊ຄຈສໍາລັດ ໃນອາດແຂ່ນໂປຖທຖະຍາຍຕິໍງໄອດັດຊຼວັກຕ້ງ.
1.1 ເພາະເຈີງການເລິບຕ່ອນສິນຄົລຊີ
Stablecoin inflows and outflows represent the clearest signal of market sentiment.
Net inflows: When large amounts of stablecoins move into exchanges, it usually signals that traders are preparing to buy crypto. More liquidity equals more potential buying power.
Net outflows: When traders pull stablecoins off exchanges into private wallets, it often means they are cautious or taking profits, expecting volatility ahead.

Think of it this way: Stablecoins are dry powder. If a wave of USDT flows into exchanges, it’s like fuel waiting to ignite a rally. Conversely, outflows can mean investors are holding back, signaling reduced appetite for risk.
1.2 Current 2025 Context
USDT remains dominant, but regional currencies like digital euro-pegged stablecoins and Asia-focused offerings are growing.
Regulatory clarity in the U.S. and Europe has legitimized stablecoins further, increasing their role as “cash equivalents” in crypto.
Recent months (mid-2025) have shown a pattern of heavy inflows during Bitcoin’s surge above $80k, followed by cautious outflows as traders hedged against corrections.
1.3 How to Track on MEXC
MEXC makes monitoring stablecoin flows simple through its exchange reserves dashboards and liquidity trackers. Unlike many platforms, MEXC offers transparency into wallet movements and allows traders to quickly see whether inflows are spiking. For beginners, this means you don’t need to analyze blockchain explorers,you get actionable insights directly on the platform.
2. Trading Volumes: Measuring Conviction Behind the Move
Volume is the backbone of market analysis. Prices can move on speculation, but without volume, those moves are fragile. A rally with low volume is like a house built on sand,it can collapse quickly. Conversely, high volume moves signal strong conviction and are harder to reverse.
2.1 Why Volumes Are Crucial
High volume + rising prices = strong bullish momentum.
High volume + falling prices = panic selling or strong bearish conviction.
Low volume moves = weak trends, prone to reversal.

2.2 2025 Market Context
Bitcoin ETFs: Since the approval of global spot Bitcoin ETFs in late 2024, trading volumes have surged to record highs, especially during U.S. trading hours.
Altcoin rotations: Traders are shifting liquidity from large-cap coins like ETH into Layer-2s and AI-linked tokens, creating volume spikes in niche assets.
Memecoin cycles: In 2025, memecoins continue to surprise, often showing the highest short-term volumes during hype waves.
For beginners, the takeaway is simple: if you see a price move but the volume isn’t supporting it, be skeptical.
2.3 How MEXC Helps
MEXC is known for its deep liquidity across hundreds of trading pairs, making its volume data especially trustworthy. Many smaller exchanges show distorted volume due to low liquidity or wash trading, but MEXC’s order books are robust, giving a realistic view of actual market participation. The platform also provides volume based filters, so traders can easily spot where the action is happening.
3. Funding Rates: The Futures Market Temperature Check
If stablecoin flows measure liquidity and volumes measure conviction, then funding rates measure leverage sentiment.
3.1 What Are Funding Rates?
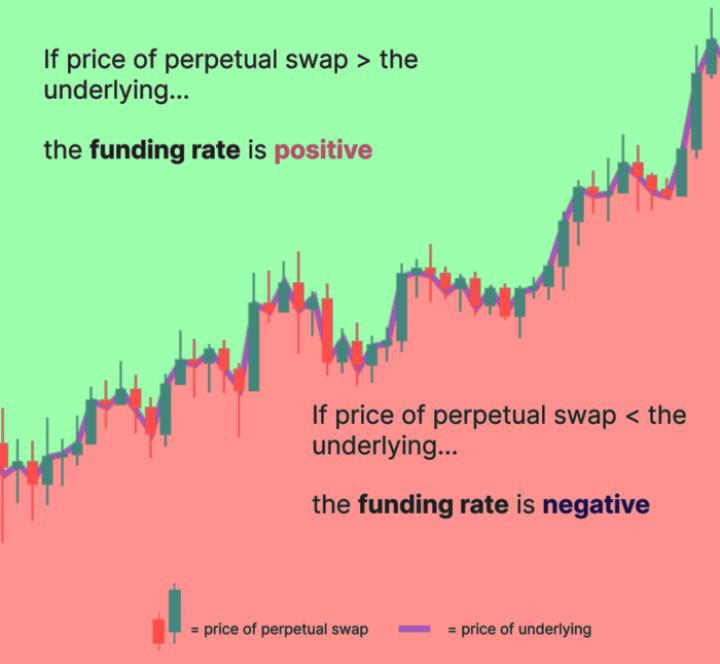
Funding rates are periodic payments exchanged between long and short traders in perpetual futures markets. They exist to keep the futures price close to the spot price:
Positive funding rate → Longs pay shorts → market is heavily long-biased (bullish sentiment).
Negative funding rate → Shorts pay longs → market is heavily short-biased (bearish sentiment).
3.2 Why They Matter
Extreme funding rates are often contrarian signals. If funding is highly positive, it means too many traders are bullish, and the market may soon correct. If it’s deeply negative, fear dominates, and a rebound may be near.
3.3 2025 Market Context
In 2025, perpetuals dominate trading, with over 70% of derivatives volume coming from perpetual contracts.
During Bitcoin’s run past $80k in May 2025, funding rates spiked to historic highs, signaling overheated leverage. Shortly after, BTC retraced, proving the signal’s reliability.
Institutions now closely monitor funding rates to adjust hedges, making this indicator even more important.
3.4 How MEXC Makes It Easy
On MEXC’s futures dashboard, funding rates are displayed clearly for every trading pair. Beginners can instantly see whether a market is overheated without diving into complex calculations. For Example: you can monitor BTC/USDT futures and ETH/USDT futures directly. MEXC also provides historical funding rate charts, helping traders spot repeating patterns.
4. The Trio in Action: Connecting the Dots
Individually, each signal is useful. Together, they become powerful.
4.1 Scenario 1: Pre-Rally Signal
Stablecoin inflows rising → traders ready to buy.
Volumes increasing → conviction is strong.
Funding rates neutral or slightly positive → no extreme leverage.
- Result: strong probability of an upcoming rally.
4.2 Scenario 2: Overheated Market
Stablecoin inflows slowing → less new liquidity.
Volumes still high → but fueled by existing traders.
Funding rates extremely positive → market crowded with longs.
- Result: correction or sudden pullback likely.
4.3 Scenario 3: Capitulation Bottom
Stablecoin outflow is huge → fear, traders pulling out.
Volumes spiking on sell-offs → panic selling.
Funding deeply negative → shorts overcrowded.
- Result: potential market bottom and rebound zone.
By reading these signals together, traders can avoid FOMO and fear-driven mistakes.
5. Why MEXC Stands Out in 2025
While many exchanges offer basic data, MEXC has built itself into one of the most reliable hubs for market intelligence.
- Deep Liquidity: With one of the highest liquidity scores in the industry, trades execute smoothly without slippage.
- Transparent Data: Real-time dashboards for stablecoin flows, volume, and funding rates.
- Range of Assets: Access to hundreds of tokens, including niche projects that often show early signals.
- Security: In the post-FTX era, trust is everything. MEXC’s reserves are regularly audited and publicly verifiable.
- Education & Community: From MEXC’S blog to the MEXC Learn, the platform empowers users to understand signals rather than blindly trade.
This makes MEXC not just a place to trade, but a one stop hub for learning, analyzing, and executing strategies.
6. Beginner’s Guide: Turning Signals into Strategy
Here’s a simple step-by-step process any beginner can follow using MEXC:
6.1 Check Stablecoin Flows
If inflows are high, be alert for potential rallies.
If outflows dominate, be cautious.
6.2 Look at Trading Volumes
Confirm whether the price action has strength behind it.
Avoid low-volume rallies,they often fail.
6.3 Analyze Funding Rates
Neutral funding = healthy market.
Extreme positive = market overheated.
Extreme negative = fear-driven sell-off, possible bounce.
6.4 Combine the Three
Example: Stablecoin inflows + rising volumes + moderate funding = a good entry point.
Example: Outflows + flat volumes + extreme positive funding = a warning sign to step back.
6.5 Execute on MEXC
Use spot trading for simple entries.
Use futures (carefully) when you spot opportunities, always with stop-losses.
Keep learning from MEXC’s tools and community.
7.Conclusion: Staying Ahead of the Curve
In 2025, the crypto market is more competitive than ever. Institutions, retail traders, and AI-driven bots all compete for alpha. But the timeless trio of stablecoin net flows, trading volumes, and funding rates remains one of the clearest ways to understand market direction.
For beginners, these signals provide a roadmap out of confusion. For professionals, they remain the backbone of sophisticated strategies. The difference between those who succeed and those who don’t often comes down to who pays attention to the right signals.
With MEXC, you’re not left guessing. The platform empowers traders with transparent data, deep liquidity, and education ,making it the ideal place to put these insights into practice.
At the end of the day, markets will always shift. But with the trio of signals guiding you, and MEXC as your trading partner, you’re far better prepared to not just survive those shifts,but thrive through them.
Disclaimer: This content is for educational and reference purposes only and does not constitute any investment advice. Digital asset investments carry high risk. Please evaluate carefully and assume full responsibility for your own decisions.
ເຂົາເຂົາໃຈ MEXC ແລະເລີ່ມການຄ້າວັນນີ້
ចុះឈ្មោះ ໃນຄິບໂຕ: ເຫດຜົນທີ່ສິນຄ້າທີ່ຖືກປ່ອນໃຫ້ເປັນໄຊເລັດໃໝ່ທີ່ໃຈສັງຄົມ")


